
Distance-Time Graph
Enroll to start learning
You’ve not yet enrolled in this course. Please enroll for free to listen to audio lessons, classroom podcasts and take practice test.
Interactive Audio Lesson
Listen to a student-teacher conversation explaining the topic in a relatable way.
Understanding the Basics of Distance-Time Graphs
🔒 Unlock Audio Lesson
Sign up and enroll to listen to this audio lesson

Today, we're going to discuss distance-time graphs. On these graphs, the y-axis represents distance, and the x-axis represents time. Can anyone tell me what a straight line on such a graph indicates?

It shows uniform speed, right?
Exactly! A straight line means the object travels equal distances in equal time intervals. Now, what do you think a curved line indicates?

That would be non-uniform speed. The speed changes!
Great job! Remember, the steeper the slope of a line, the greater the speed. Does everyone remember what we call the speed of an object represented by the slope in these graphs?

Um, I think it's also related to velocity?
Close! It’s the speed represented through the slope. Velocity includes direction, while speed does not. Let’s summarize: a straight line on the graph indicates uniform speed, while a curve shows non-uniform speed.
Interpreting Distance-Time Graphs
🔒 Unlock Audio Lesson
Sign up and enroll to listen to this audio lesson

Now that we know what the lines mean, let's analyze a distance-time graph together. What do you see in this graph displayed?

It starts with a straight line, then goes up steeply, and then flattens out at the top!
Very observant! The initial straight line indicates uniform speed. The steep line means the object is speeding up, while the flat section shows the object is stationary. So, what physical scenario could this represent?
Maybe it’s a runner who speeds up, then rests?
Precisely! Understanding this allows us to picture motion scenarios with clarity. Before we finish this session, can anyone summarize what the different slopes indicate?
Steeper slopes mean higher speed, and flat means at rest!
Real-Life Applications of Distance-Time Graphs
🔒 Unlock Audio Lesson
Sign up and enroll to listen to this audio lesson
Distance-time graphs aren't just academic; they can help in real life. Can anyone think of where these graphs apply?
I think in transportation, like planning bus routes!
Absolutely! They're crucial in analyzing travel times and distances. In sports, they help coaches understand how athletes perform. Can anyone think of another relevant example?
Maybe in physics labs when we track the motion of a cart?
Yes, excellent! These graphs provide essential insights into motion patterns. Let's summarize: distance-time graphs are vital in transportation and performance analysis by reflecting motion characteristics.
Introduction & Overview
Read summaries of the section's main ideas at different levels of detail.
Quick Overview
Standard
Distance-time graphs are a vital tool in kinematics, representing the relationship between distance and time in motion. A straight line indicates uniform speed, while a curve represents non-uniform speed, providing insights into an object's motion characteristics.
Detailed
Detailed Summary
Distance-time graphs are essential in understanding motion in kinematics. These graphs plot distance on the y-axis and time on the x-axis, visually representing an object's movement over time. The key features of distance-time graphs include:
- Straight Lines: Indicate uniform speed, where the object travels equal distances in equal intervals of time.
- Curved Lines: Represent non-uniform speed, where the object's speed changes over time. The slope of the line indicates the speed—steeper slope means higher speed, and a flat line indicates the object is at rest.
Grasping the concepts surrounding distance-time graphs is crucial for students as they serve as a foundation for further understanding other kinematic graphs, such as speed-time graphs.
Youtube Videos


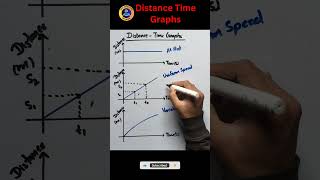


![Distance Time Graph [Explained with 3D Animated Video] | Alyss](https://img.youtube.com/vi/tSnT_UjKvyE/mqdefault.jpg)
Audio Book
Dive deep into the subject with an immersive audiobook experience.
Overview of Distance-Time Graphs
Chapter 1 of 1
🔒 Unlock Audio Chapter
Sign up and enroll to access the full audio experience
Chapter Content
Distance-Time Graph:
○ Straight line: Uniform speed.
○ Curved line: Non-uniform speed.
Detailed Explanation
A Distance-Time Graph is a visual representation that shows how an object moves over time. The key points to note are:
1. Straight Line: When the graph shows a straight line, it indicates that the object is moving at a constant speed. This means the distance covered is equal in equal time intervals.
2. Curved Line: If the line on the graph is curved, it signifies that the object’s speed is changing; this is known as non-uniform speed. In this case, the object does not cover equal distances in equal time intervals. Depending on whether the line curves upwards or downwards, you can tell whether the object is speeding up or slowing down.
Examples & Analogies
Imagine you are driving a car on a straight road. If you maintain the same speed, the distance you travel in each minute is the same. This is represented by a straight line on the graph. However, if you start speeding up—like when you press the accelerator—your graph would curve upwards, indicating you’re traveling further each minute than the last. Conversely, if you’re approaching a stop and slowing down, the line might curve downwards.
Key Concepts
-
Distance-Time Graph: A graphical representation where distance is plotted against time.
-
Straight Line: Indicates uniform motion at constant speed.
-
Curved Line: Indicates changing speed, or non-uniform motion.
-
Slope: Represents speed in a distance-time graph; steep slope means high speed.
Examples & Applications
A car traveling at a constant speed for 2 hours would be represented by a straight line on a distance-time graph.
A runner accelerating from rest is represented by a curved line that becomes steeper over time.
Memory Aids
Interactive tools to help you remember key concepts
Rhymes
When the line is straight and true, speed's the same, that's the cue!
Stories
Imagine a car (the graph) on a road (time). If it drives straight (straight line), it's cruising at a constant speed. If it weaves left and right (curved line), it's changing its speed.
Memory Tools
Speedy Steep = Fast; Flat Calm = No Speed.
Acronyms
G.R.A.P.H - Graphs Reflect A Person’s Hustle (distance-time graph movement).
Flash Cards
Glossary
- Distance
Total path covered by a moving object.
- Time
Duration over which motion occurs.
- Uniform Speed
Constant speed over time; represented by straight lines.
- Nonuniform Speed
Variable speed over time; represented by curved lines.
- Slope
The steepness of a line in a graph; indicates speed.
Reference links
Supplementary resources to enhance your learning experience.