
Speed-Time Graph
Enroll to start learning
You’ve not yet enrolled in this course. Please enroll for free to listen to audio lessons, classroom podcasts and take practice test.
Interactive Audio Lesson
Listen to a student-teacher conversation explaining the topic in a relatable way.
Introduction to Speed-Time Graphs
🔒 Unlock Audio Lesson
Sign up and enroll to listen to this audio lesson

Welcome everyone! Today, we’re going to explore speed-time graphs. Who can tell me what speed is?

Isn't speed how fast something is moving?
Exactly! Now, when we plot speed against time, we create a speed-time graph. This graph helps us analyze how speed changes over time. Can anyone tell me what a horizontal line on such a graph implies?

A horizontal line means the speed is constant!
Great job! And what about a sloped line?

It means the speed is changing, like accelerating or decelerating.
Exactly! So remember, a horizontal line indicates constant speed, while a slope indicates a change. Let's summarize: horizontal = constant speed, sloped = changing speed.
Understanding Acceleration and Deceleration in Graphs
🔒 Unlock Audio Lesson
Sign up and enroll to listen to this audio lesson

Now, let’s dive deeper into what acceleration and deceleration look like on speed-time graphs. If I show you a graph with a positive slope, what does that tell us?

It suggests the object is accelerating!
Correct! And if the slope is negative?
That would mean the object is decelerating.
Exactly! Acceleration is when the speed increases, while deceleration means the speed decreases. Always remember, the slope tells us a lot about the motion of the object! Let’s summarize: positive slope = acceleration, negative slope = deceleration.
Practical Applications of Speed-Time Graphs
🔒 Unlock Audio Lesson
Sign up and enroll to listen to this audio lesson
Can anyone think of real-life situations where speed-time graphs are applied?
Racing cars! They need to know how fast to go at different times.
What about trains or planes?
Absolutely! Speed-time graphs help engineers and pilots understand and optimize speed. They also inform safety regulations. Keep in mind that these graphs are everywhere in transportation. Summarizing today: speed-time graphs are analytical tools for both physics and real-world applications.
Introduction & Overview
Read summaries of the section's main ideas at different levels of detail.
Quick Overview
Standard
Speed-time graphs are essential in understanding how speed changes over time. A horizontal line signifies constant speed, while a sloped line indicates acceleration or deceleration. Analyzing these graphs helps in deriving key conclusions about an object's motion.
Detailed
Speed-Time Graph
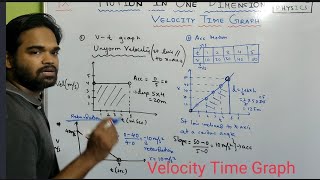
A Speed-Time Graph provides a visual representation of an object’s speed as it changes over time. In such graphs, the x-axis represents time, while the y-axis represents speed. These graphs are crucial in kinematics for identifying the nature of motion:
- A horizontal line signifies constant speed, indicating that the object's speed remains unchanged during that time interval.
- A sloped line indicates either acceleration (if the slope is positive) or deceleration (if the slope is negative). This allows us to deduce how an object’s speed changes relative to the time elapsed. Understanding how to interpret these graphs is vital for students studying motion, as they depict key relationships and can be analyzed to solve various kinematic problems.
Youtube Videos


Audio Book
Dive deep into the subject with an immersive audiobook experience.
Understanding Speed-Time Graphs
Chapter 1 of 2
🔒 Unlock Audio Chapter
Sign up and enroll to access the full audio experience
Chapter Content
● Speed-Time Graph:
○ Horizontal line: Constant speed.
○ Sloped line: Acceleration or deceleration.
Detailed Explanation
A speed-time graph is a type of graph that shows how speed varies over time. The horizontal axis (x-axis) represents time, while the vertical axis (y-axis) represents speed. When the line on the graph is horizontal, it indicates that the speed is constant, meaning there is no acceleration or deceleration. In contrast, if the line is sloped, it indicates either acceleration (speed increasing) or deceleration (speed decreasing), depending on the direction of the slope.
Examples & Analogies
Think of riding a bicycle. If you pedal consistently at the same pace, the speed-time graph would show a flat line (horizontal line), indicating constant speed. However, if you start pedaling harder to go faster, the line would slope upwards (indicating acceleration). If you then slow down to a stop, the line would slope downwards (indicating deceleration).
Constant Speed vs. Variable Speed
Chapter 2 of 2
🔒 Unlock Audio Chapter
Sign up and enroll to access the full audio experience
Chapter Content
○ Horizontal line: Constant speed.
○ Sloped line: Acceleration or deceleration.
Detailed Explanation
In a speed-time graph, a horizontal line indicates that an object is moving at a constant speed, where the speed does not change over time. This means that for each unit of time, the object covers the same distance. Conversely, a sloped line shows that the object's speed changes. If the line slopes upwards, it signifies acceleration, meaning the speed is increasing. A downward slope indicates deceleration, where the speed decreases.
Examples & Analogies
Imagine driving a car on a straight road. If you maintain a steady speed of 60 km/h, the graph will show a flat horizontal line. If you press the gas pedal and accelerate to 80 km/h, the line will rise sharply. If you then apply the brakes to slow down to 40 km/h, you would see the line slope downwards.
Key Concepts
-
Speed-Time Graph: A visual representation of an object’s speed over time.
-
Horizontal Line: Represents constant speed in a speed-time graph.
-
Slope: Indicates acceleration (positive slope) or deceleration (negative slope).
-
Acceleration: The rate at which speed increases over time.
-
Deceleration: The rate at which speed decreases over time.
Examples & Applications
When a car travels at a constant speed of 60 km/h, the speed-time graph will show a horizontal line at 60 km/h.
If a cyclist accelerates from rest to 20 km/h over 10 seconds, the graph will show a positive slope rising from the origin.
Memory Aids
Interactive tools to help you remember key concepts
Rhymes
On a graph so fine, if it's straight and flat, the speed is constant, imagine that!
Stories
Once there was a race car. It went fast at full speed on a straight path (horizontal line) but had to slow down (negative slope) to reach the pit stop safely.
Memory Tools
SPEED: Slope Equals Positive for Increase, Decline for Decrease.
Acronyms
SPEED
stands for Speed
for Positive slope is Increase
for Equal means Constant
for Decrease means Negative slope.
Flash Cards
Glossary
- SpeedTime Graph
A graph that displays how an object's speed changes over time, with speed along the vertical axis and time along the horizontal axis.
- Horizontal Line
A line on the graph indicating constant speed where the speed does not change over the given time.
- Slope
The steepness or angle of a line on a graph; determines whether the speed is increasing (positive slope) or decreasing (negative slope).
- Acceleration
The rate of change of velocity; occurs when an object’s speed increases.
- Deceleration
The rate of change of velocity; occurs when an object’s speed decreases.
Reference links
Supplementary resources to enhance your learning experience.