
JVM Tools
Enroll to start learning
You’ve not yet enrolled in this course. Please enroll for free to listen to audio lessons, classroom podcasts and take practice test.
Interactive Audio Lesson
Listen to a student-teacher conversation explaining the topic in a relatable way.
Introduction to JVM Tools
🔒 Unlock Audio Lesson
Sign up and enroll to listen to this audio lesson

Today, we will explore various JVM tools that assist with monitoring memory usage and garbage collection. Let's start with jconsole. Can anyone tell me what jconsole is used for?

Isn't jconsole a GUI-based tool for monitoring applications?
Exactly! It's user-friendly and allows us to see memory usage and GC activity in real-time. This is crucial for optimizing our Java applications.

What about jvisualvm? How does it differ from jconsole?
Great question! jvisualvm is a more advanced tool that provides profiling alongside monitoring. It helps identify performance bottlenecks and memory leaks. Remember, both tools help us in monitoring, but jvisualvm gives more detailed insights.

What command-line tools should we know about?
We have jstat, jmap, and jstack. jstat is used for collecting JVM statistics, jmap helps diagnose memory issues, and jstack provides thread stack traces. Can anyone think of a scenario where you'd use jmap?

If we suspect a memory leak, we could use jmap to analyze the heap dump!
Exactly! Now, let's recap. jconsole and jvisualvm are primarily for monitoring; jstat, jmap, and jstack are command-line tools to dig deeper into JVM performance.
Practical Applications of JVM Tools
🔒 Unlock Audio Lesson
Sign up and enroll to listen to this audio lesson

We’ve talked about the tools; now let's discuss how to use them effectively for garbage collection tuning. How do we start using jconsole?
We can connect it to a running Java application, right?
That's correct! Once connected, you can monitor memory usage and GC activity. For JVM tuning, understanding the output from these tools is vital. Who can tell me why that is?
If we understand memory usage patterns, we can adjust the heap sizes appropriately.
Exactly. For example, with the jmap tool, we can generate a heap dump. Analyzing this dump helps us see which objects are consuming the most memory. Why is this important?
To identify potential memory leaks and optimize memory consumption.
Absolutely! Each tool provides different perspectives on JVM performance. Utilizing them can help ensure your applications run smoothly and efficiently.
Monitoring and Reporting
🔒 Unlock Audio Lesson
Sign up and enroll to listen to this audio lesson
We've learned about various JVM tools. What do you think is the best practice when it comes to JVM monitoring?
We should regularly monitor our applications to catch any performance issues early.
That's a key strategy. Consistent monitoring can prevent serious performance bottlenecks. For instance, using jvisualvm can reveal how much memory is being used by different classes.
What should we do if we find objects that are not being released?
We should investigate why they are still being referenced. This might involve checking for static variables or listeners that were not deregistered. Remember the term ‘memory leak’? It's crucial to fix these leaks.
So, continuous monitoring and fine-tuning our parameters based on what we see can lead to better application performance?
Exactly! Effective monitoring and tuning form the backbone of robust application performance. Always be proactive!
Introduction & Overview
Read summaries of the section's main ideas at different levels of detail.
Quick Overview
Standard
JVM tools play a vital role in monitoring garbage collection and memory management in Java. Tools such as jconsole, jvisualvm, and command-line utilities provide insights into memory usage and help developers optimize application performance.
Detailed
JVM Tools
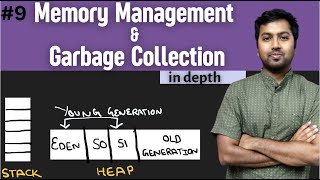
In this section, we delve into the key tools provided for monitoring and tuning garbage collection within the Java Virtual Machine (JVM). Proper management of garbage collection is essential for Java applications to run efficiently, especially in large-scale environments. The tools covered include:
- jconsole: A GUI-based tool that allows users to monitor Java applications in real-time, checking memory usage and garbage collection activity.
- jvisualvm: This is an advanced profiling tool that not only provides GC activity insights but also tracks memory usage and application performance.
- jstat, jmap, and jstack: These are command-line monitoring tools designed to analyze various aspects of the JVM. jstat gives stats on memory and GC, jmap can be used to diagnose memory leaks, and jstack is useful for thread stack traces.
By utilizing these tools, developers can gain better control over memory management, allowing for data-driven decisions to optimize their applications.
Youtube Videos

Audio Book
Dive deep into the subject with an immersive audiobook experience.
jconsole Tool
Chapter 1 of 3
🔒 Unlock Audio Chapter
Sign up and enroll to access the full audio experience
Chapter Content
- jconsole – GUI-based monitoring tool
Detailed Explanation
The jconsole tool is a graphical user interface (GUI) application that comes with the Java Development Kit (JDK). It allows developers to monitor and manage Java applications that run on the Java Virtual Machine (JVM). Using jconsole, you can view details about memory usage, thread activity, and overall performance of your Java applications, making it easier to identify potential issues.
Examples & Analogies
Think of jconsole as a vehicle's dashboard that displays important information like speed, fuel level, and engine temperature. Just as a driver uses this information to ensure the vehicle runs smoothly, developers use jconsole to keep an eye on their Java applications and make sure they are performing efficiently.
jvisualvm Tool
Chapter 2 of 3
🔒 Unlock Audio Chapter
Sign up and enroll to access the full audio experience
Chapter Content
- jvisualvm – Profiling, GC activity, memory usage
Detailed Explanation
jvisualvm is a more advanced tool compared to jconsole, offering profiling capabilities, which means it can analyze application performance in more detail. It provides insights into garbage collection (GC) activity, memory usage, and CPU usage. Developers can use jvisualvm to take snapshots of their Java applications and analyze where time and resources are being spent, helping to optimize performance and discover memory leaks.
Examples & Analogies
Consider jvisualvm as a mechanic's diagnostic tool that not only checks the oil and tire pressure but also runs comprehensive tests to diagnose any underlying issues. Just as a mechanic uses diagnostic tools to ensure that your car is operating at its best, jvisualvm helps Java developers ensure their applications are efficient and running smoothly.
Command-Line Monitoring Tools
Chapter 3 of 3
🔒 Unlock Audio Chapter
Sign up and enroll to access the full audio experience
Chapter Content
- jstat, jmap, jstack – Command-line monitoring
Detailed Explanation
These are command-line tools that offer different functionalities for monitoring and managing the JVM. jstat allows you to monitor JVM statistics, jmap helps you get memory-related information such as heap usage, and jstack provides thread stack traces. These tools are lightweight and can be run from the command line, making them useful for developers who prefer working with terminal commands or who need to script their monitoring processes.
Examples & Analogies
Imagine using a toolkit filled with various tools like a wrench, screwdriver, and measuring tape for specific jobs. Each of these command-line tools serves a specific purpose, just like different tools in a toolbox. When working on a project, you can pick the right tool from the toolkit (jstat, jmap, or jstack) based on the task you want to perform, whether it's monitoring system performance or diagnosing an issue.
Key Concepts
-
jconsole: A GUI tool for monitoring Java applications.
-
jvisualvm: An advanced profiling tool for performance analysis.
-
jstat: A command-line tool for stat monitoring.
-
jmap: Generates memory maps and dump analysis.
-
jstack: Provides thread stack trace information.
Examples & Applications
Using jconsole to monitor real-time memory usage and inspect active threads.
Analyzing a heap dump with jmap to identify memory leaks in an application.
Memory Aids
Interactive tools to help you remember key concepts
Rhymes
JConsole is handy, for live stats it’s dandy, / JVisualVM is advanced, for insights it’ll prance.
Stories
Imagine a detective (jconsole) watching over a city (Java app), keeping track of every move for security. Suddenly, an advanced analyst (jvisualvm) joins in, analyzing every detail and helping find hidden patterns.
Memory Tools
Remember 'JVS' for Java Visual Stats: Jconsole, VisualVM for memory, and Stack for threads.
Acronyms
Use JAG
Jconsole
JvisualVM
and jmap for complete JVM monitoring.
Flash Cards
Glossary
- jconsole
A GUI-based tool for monitoring Java applications' performance metrics and resource consumption.
- jvisualvm
An advanced profiling tool that provides insights into memory usage and helps detect potential performance issues.
- jstat
A command-line tool that monitors and provides statistics about garbage collection and memory management in the JVM.
- jmap
A command-line tool for generating memory maps and detailed memory usage statistics for Java applications.
- jstack
A command-line tool that prints Java thread stack traces for monitoring thread behavior and diagnosing blocking issues.
Reference links
Supplementary resources to enhance your learning experience.