
Monitoring and Tuning Garbage Collection
Enroll to start learning
You’ve not yet enrolled in this course. Please enroll for free to listen to audio lessons, classroom podcasts and take practice test.
Interactive Audio Lesson
Listen to a student-teacher conversation explaining the topic in a relatable way.
Introduction to JVM Tools
🔒 Unlock Audio Lesson
Sign up and enroll to listen to this audio lesson

Today, we'll be looking at some powerful tools that Java offers for monitoring garbage collection. Why do you think it's important to monitor GC?

It helps us identify problems like memory leaks or performance issues.
Exactly! Tools like `jconsole` and `jvisualvm` are designed for this. Can anyone explain what `jconsole` does?

Isn't it a GUI tool that helps us monitor various metrics, including memory usage?
Correct! It visualizes the GC stats in real-time. We can see memory levels and thread activity. Now, what about `jvisualvm`?

It profiles applications and keeps track of GC activity, right?
Yes! It's powerful for analyzing performance issues. To remember these tools, think of 'Visual Monitor' for `jvisualvm`.
Let's recap: what tools would you use for monitoring GC?

`jconsole` and `jvisualvm`, plus command-line tools like `jstat`!
JVM Options for GC Tuning
🔒 Unlock Audio Lesson
Sign up and enroll to listen to this audio lesson

Now that we've covered the tools, let's talk about tuning GC using JVM options. Why is tuning important?
It helps improve application performance by reducing pauses during garbage collection!
That's right! You can set the initial and maximum heap size with `-Xms` and `-Xmx`. Can anyone explain how that helps?
It prevents the JVM from resizing the heap during runtime, which can be costly.
Well said! Also, using `-verbose:gc` allows us to see detailed logs of each GC event. Who remembers how to enable this?
By adding the option when starting the JVM?
Exactly! Coupled with `-XX:+PrintGCDetails`, we get a comprehensive view. How would you summarize our discussion on tuning?
We can use heap size options and GC verbose flags to optimize garbage collection!
Introduction & Overview
Read summaries of the section's main ideas at different levels of detail.
Quick Overview
Standard
Monitoring and tuning garbage collection in Java can significantly impact application performance. This section delves into various JVM tools for monitoring garbage collection, such as jconsole and jvisualvm, and provides JVM options to optimize garbage collection processes.
Detailed
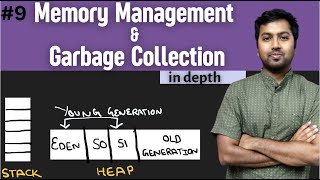
Monitoring and Tuning Garbage Collection
Garbage collection (GC) is a crucial process in Java's memory management, and understanding how to monitor and tune it is essential for optimizing application performance. This section outlines the utilities available for developers, including built-in JVM tools like jconsole, jvisualvm, and command-line tools such as jstat, jmap, and jstack. The section further discusses various JVM options that allow developers to fine-tune garbage collection. These options include -verbose:gc for detailed GC logs, -Xms and -Xmx to set heap size, and -XX:+PrintGCDetails to print comprehensive GC statistics.
Each tuning parameter can help manage the performance trade-offs between garbage collection time and application throughput, making it crucial for developers to use these tools effectively.
Youtube Videos


Audio Book
Dive deep into the subject with an immersive audiobook experience.
JVM Tools for Monitoring
Chapter 1 of 2
🔒 Unlock Audio Chapter
Sign up and enroll to access the full audio experience
Chapter Content
- jconsole – GUI-based monitoring tool
- jvisualvm – Profiling, GC activity, memory usage
- jstat, jmap, jstack – Command-line monitoring
Detailed Explanation
In Java, monitoring the performance of the garbage collector (GC) is crucial to ensuring that applications run efficiently. Several tools assist developers in this process:
- jconsole: This is a graphical user interface (GUI) tool that allows for monitoring the Java Virtual Machine (JVM) and its memory usage in real-time. You can easily see how much memory is in use, how many threads are active, and other performance metrics.
- jvisualvm: This tool goes a step further by providing profiling capabilities. It can be used to visualize garbage collection activity, memory usage, and thread activity. This allows developers to pinpoint performance issues related to memory and GC.
-
jstat, jmap, jstack: These are command-line tools that provide detailed statistics about the JVM.
jstatgives you GC statistics,jmapprovides a memory map, andjstackshows the current thread stack traces. They are especially useful for automated scripts or when performance issues are observed in production settings.
Examples & Analogies
Imagine a manager monitoring a restaurant's kitchen. The manager can use different tools: a notebook (like jconsole) to quickly jot down observations about what’s cooking, a kitchen camera (like jvisualvm) to see all the activity and identify bottlenecks in food prep, and order tickets (like jstat) to check the status of each dish. Just as the manager needs all these tools to keep the kitchen running smoothly, developers use these Java tools to ensure optimal performance and memory management.
JVM Options for GC Tuning
Chapter 2 of 2
🔒 Unlock Audio Chapter
Sign up and enroll to access the full audio experience
Chapter Content
-verbose:gc # Prints GC details
-Xms512m -Xmx2048m # Set heap size
-XX:+PrintGCDetails # Show GC stats
-XX:+UseG1GC # Use G1 collector
Detailed Explanation
Tuning the parameters of the JVM is essential for optimizing garbage collection performance. Here are some key options available to developers:
- -verbose:gc: This option prints details about each garbage collection event that occurs during the application run. It can provide insights into how often GC runs and how much memory is reclaimed, helping to identify performance issues.
-
-Xms512m -Xmx2048m: These parameters set the initial and maximum heap sizes for the application. By defining a range for the heap size, you can optimize memory usage and prevent
OutOfMemoryErrorsituations by ensuring there is enough memory allocated to the application as it scales. Here, the initial size is set to 512 megabytes, and the maximum is set to 2048 megabytes. - -XX:+PrintGCDetails: This flag provides detailed statistics about the garbage collection process, including how much memory was in use before and after GC activities. This is useful for analyzing the impact of GC on application performance.
- -XX:+UseG1GC: This option specifies that the application should utilize the G1 Garbage Collector, which is designed to address larger heaps and reduce pause times, making applications more responsive.
Examples & Analogies
Think of tuning the JVM options as adjusting the settings on your coffee maker. If you set it to brew at a higher temperature (like increasing heap size), your coffee (an application) brews faster and more effectively. Conversely, if you use the wrong settings, your coffee could taste bad or take too long to brew. Just like adjusting the brewing process can affect how your coffee turns out, adjusting JVM options can significantly impact an application's performance.
Key Concepts
-
Garbage Collection Tools: Essential tools for monitoring and tuning Java's garbage collection process.
-
Heap Size Options: JVM options like -Xms and -Xmx that affect memory allocation for Java applications.
Examples & Applications
Using the command java -jar yourApp.jar -Xms512m -Xmx2048m to set the heap size for your Java application.
Enabling detailed GC logs by adding -verbose:gc and -XX:+PrintGCDetails to the Java command line.
Memory Aids
Interactive tools to help you remember key concepts
Rhymes
When garbage fills the Java scene, use jconsole to keep it clean!
Stories
Imagine a factory where workers (Java threads) can only operate if the floor (heap) is clear. The manager (GC) must consistently monitor and clear garbage (unreachable objects) to maintain productivity.
Memory Tools
Remember 'GC Tune Up' to recall the main JVM options for tuning: G for GC details, C for CPU time, T for tuning size limits.
Acronyms
Use the acronym TGC (Tune Garbage Collection) to remember the main focus areas
Tools
Guidelines
and Configuration parameters.
Flash Cards
Glossary
- jconsole
A GUI-based monitoring tool for Java applications that can view and manage Java applications using JMX.
- jvisualvm
A profiling tool for monitoring, visualizing, and diagnosing Java applications, including garbage collection performance.
- jstat
A command line utility that provides statistics about the Java Virtual Machine, specifically for monitoring memory usage.
- jmap
A utility for obtaining memory maps of Java processes to analyze memory usage.
- jstack
A command line tool that prints Java thread stacks for troubleshooting.
- GC Tuning
Adjustments made to the garbage collection process in order to optimize the Java application's performance.
Reference links
Supplementary resources to enhance your learning experience.