
Adjustment in Class Interval
Enroll to start learning
You’ve not yet enrolled in this course. Please enroll for free to listen to audio lessons, classroom podcasts and take practice test.
Interactive Audio Lesson
Listen to a student-teacher conversation explaining the topic in a relatable way.
Understanding Class Intervals
🔒 Unlock Audio Lesson
Sign up and enroll to listen to this audio lesson

Welcome everyone! Today, we are going to discuss class intervals in frequency distributions. Can anyone tell me what a class interval is?

Isn’t it the range of values in a particular class?
Exactly! A class interval is the range within which data points fall. Now, let’s think about what happens when there's no continuity between classes.

Like, if the upper limit of one class doesn’t connect to the lower limit of the next?
Correct! This gap can misrepresent the data. That’s precisely why we need class interval adjustments. Can anyone suggest how we might adjust them?

Maybe we can overlap the classes a bit?
Good thought! We actually adjust the limits mathematically. Let’s dive into those adjustments next!
To recap, class intervals define ranges of data, and their adjustment is essential to maintain continuity.
Adjusting Class Intervals
🔒 Unlock Audio Lesson
Sign up and enroll to listen to this audio lesson

Now let's discuss how we adjust the class intervals. First, we need to find the difference between the upper limit of the first class and the lower limit of the second class. Can someone provide an example from our earlier class?

If our first class ends at 899 and the next starts at 900, the difference is 1.
Exactly! We take that difference of 1, divide it by 2, which gives us 0.5. Now we subtract 0.5 from all lower limits and add it to all upper limits. Can anyone calculate that?
For the first class, the lower limit becomes 899.5 and the upper limit becomes 899.5!
Great! And this process is repeated for all classes. This adjustment helps keep our data representation accurate and clear. Remember, without these adjustments, we would misrepresent the data!
To summarize, adjusting class intervals is crucial to eliminate gaps in our frequency distribution, which helps in better understanding our data.
Practical Applications of Adjusted Class Intervals
🔒 Unlock Audio Lesson
Sign up and enroll to listen to this audio lesson
Let’s think about how adjusted class intervals apply in real life. Can anyone think of a scenario where this would be useful?
Maybe in analyzing incomes or grades?
Absolutely! For instance, when we analyze income data and create income classes. If there's a gap, we misrepresent income distribution which can lead to faulty conclusions.
So, using adjusted intervals gives a clear view of the data?
Exactly! The more coherent our classifications, the better our analyses and conclusions. Who can remember the steps after our discussions today?
Find the difference, halve it, adjust lower limits down and upper limits up!
Correct! Great job, everyone. Always remember the importance of clarity and continuity in data representation.
Introduction & Overview
Read summaries of the section's main ideas at different levels of detail.
Quick Overview
Standard
In this section, we explore the method of adjusting class intervals for continuous variables in frequency distributions. The objective is to remove any gaps between the upper limit of one class and the lower limit of the subsequent class. By employing this adjustment technique, we can create a more coherent classification that reflects continuous data without discontinuities, thereby making statistical analysis more accurate.
Detailed
Adjustment in Class Interval
Adjusting class intervals in frequency distributions is essential for accurately representing continuous data. This section emphasizes the significance of maintaining continuity between classes. For instance, if there is a gap between the upper limit of one class and the lower limit of the next, it interrupts the continuity, which may lead to erroneous interpretations of the data.
To adjust the class intervals, we take the following steps:
- Find the Difference: Calculate the difference between the lower limit of the second class and the upper limit of the first class.
- Halve the Difference: Divide this difference by two to find a suitable adjustment value.
- Adjust Lower Limits: Subtract this adjustment value from the lower limits of all classes.
- Adjust Upper Limits: Add the same adjustment value to the upper limits of all classes.
The adjustments ensure that there are no gaps in the classification structure, leading to a more comprehensive representation of the data. The adjusted frequency distribution provides a realistic portrayal of how the data points fall into different classes, enhancing subsequent statistical analysis.
Youtube Videos


Audio Book
Dive deep into the subject with an immersive audiobook experience.
Understanding the Need for Adjustment
Chapter 1 of 3
🔒 Unlock Audio Chapter
Sign up and enroll to access the full audio experience
Chapter Content
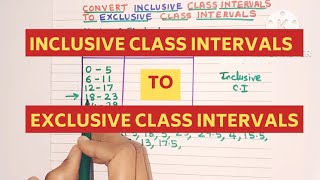
A close observation of the Inclusive Method in Table 3.4 would show that though the variable “income” is a continuous variable, no such continuity is maintained when the classes are made. We find “gap” or discontinuity between the upper limit of a class and the lower limit of the next class. For example, between the upper limit of the first class: 899 and the lower limit of the second class: 900, we find a gap of 1.
Detailed Explanation
In a frequency distribution, when we categorize data into classes, we might create gaps between the classes if they are not adjusted properly. For example, if one class ends at 899 and the next begins at 900, there's a gap of 1 unit. This lack of continuity can misrepresent the data, particularly if we are dealing with continuous variables like income.
Examples & Analogies
Think of it as sorting people into height categories: if one group ends at 150 cm and the next starts at 151 cm, you have a gap. But if we adjust the groups to overlap slightly (say, 150 cm to 151 cm), we have a smoother transition. This overlap makes it easier to understand how many people fall within that range.
How to Adjust Class Intervals
Chapter 2 of 3
🔒 Unlock Audio Chapter
Sign up and enroll to access the full audio experience
Chapter Content
To ensure the continuity of the variable while classifying data, this is achieved by making an adjustment in the class interval. The adjustment is done in the following way: 1. Find the difference between the lower limit of the second class and the upper limit of the first class. For example, in Table 3.4 the lower limit of the second class is 900 and that the upper limit of the first class is 899. The difference between them is 1, i.e. (900 – 899 = 1) 2. Divide the difference obtained in (1) by two i.e. (1/2 = 0.5) 3. Subtract the value obtained in (2) from lower limits of all classes (lower class limit – 0.5) 4. Add the value obtained in (2) to upper limits of all classes (upper class limit + 0.5).
Detailed Explanation
Adjusting class intervals ensures there are no gaps between classes. First, we check the gap length; if the next class starts at 900 and the previous class ends at 899, the gap is 1 unit. We then halve this gap (to 0.5) and adjust all class boundaries. So, we reduce 0.5 from each lower limit and add 0.5 to each upper limit. This way, the classes overlap slightly, eliminating gaps.
Examples & Analogies
Imagine you are organizing your books. If one shelf ends at a certain height and the next shelf starts way above that, it looks awkward. Instead, by making the shelves overlap slightly, books can be placed neatly, and finding a particular book becomes easier. This is similar to adjusting our class intervals.
Result of Adjustments
Chapter 3 of 3
🔒 Unlock Audio Chapter
Sign up and enroll to access the full audio experience
Chapter Content
After the adjustments in class limits, the equality (1) that determines the class mark would be modified as follows: Adjusted Class Mark = (Adjusted Upper Class Limit + Adjusted Lower Class Limit)/2.
Detailed Explanation
After adjusting the class intervals, we re-calculate the class mark. The class mark is the midpoint of each class, and by adjusting the limits, we ensure that the class marks now accurately represent the values in those classes without leaving out any data. The adjusted class mark is simply the average of the newly adjusted lower and upper limits.
Examples & Analogies
Think about a scale where you've marked the middle point for weights. If you shift your scale up or down, that middle point has to be recalculated to ensure it's still accurately reflecting the average of what's on your scale. This allows for a more precise and usable measurement.
Key Concepts
-
Class Intervals: The ranges of values into which data points are grouped.
-
Continuity: The seamless transition with no gaps between class intervals.
-
Adjustment Procedure: The method used to modify class limits for seamless continuity.
Examples & Applications
When analyzing student grades, if the upper limit of a grading class is 79.5 and the next begins at 80, adjusting involves addressing the gap by changing the limits appropriately.
In income data, if the first class limit is set as 899.5 and the second begins at 900, the adjustment is to create a gap-less integration.
Memory Aids
Interactive tools to help you remember key concepts
Rhymes
To gather data, let’s make it neat, Adjust those gaps for a solid suite!
Stories
Once in a data town, gaps appeared, each class was lonely, it was feared! Adjustments were made, limits aligned, now the data danced, perfectly combined!
Memory Tools
A.G.A.P. - Adjustment, Gap, Adjust limits, Perfection in data!
Acronyms
C.A.L.M. - Class And Limits Matter!
Flash Cards
Glossary
- Class Interval
A range of values used to classify data points in frequency distributions.
- Continuity
The seamless connection between consecutive class intervals in frequency distributions.
- Frequency Distribution
A table that shows the number of occurrences (frequency) of each class interval.
- Upper Class Limit
The highest value within a class interval.
- Lower Class Limit
The lowest value within a class interval.
Reference links
Supplementary resources to enhance your learning experience.