
How to prepare a Frequency Distribution
Enroll to start learning
You’ve not yet enrolled in this course. Please enroll for free to listen to audio lessons, classroom podcasts and take practice test.
Interactive Audio Lesson
Listen to a student-teacher conversation explaining the topic in a relatable way.
Introduction to Frequency Distribution
🔒 Unlock Audio Lesson
Sign up and enroll to listen to this audio lesson

Today we'll learn how to prepare a frequency distribution. Can anyone explain why we need to organize data this way?

To make it easier to analyze, I think?
Exactly! Organizing data helps us see patterns and makes it easier to understand. Now, can anyone tell me what a class in statistics means?

Is it like a group of data points that share similar values?
Right! A class groups similar data points together. Remember the acronym C.L.A.S.S., which stands for 'Classification Leads to Analysis of Statistical Samples'.

That’s a good way to remember it!
Great! Let's dive deeper into how to construct these classes.
Choosing Class Intervals
🔒 Unlock Audio Lesson
Sign up and enroll to listen to this audio lesson

When preparing a frequency distribution, should we use equal or unequal class intervals?

I think it depends on the data's range?
Correct! For example, if we're dealing with income, we might prefer unequal intervals because income levels can vary greatly.
So, how do we decide the size of each class?
Good question! We typically divide the range by the number of classes we want. Remember, the range is the difference between the highest and lowest values.
That seems straightforward!
Yes, but let's practice this with some data soon!
Calculating Frequencies
🔒 Unlock Audio Lesson
Sign up and enroll to listen to this audio lesson
Now that we've established our classes, how do we calculate the frequency?
By counting how many data points fit into each class?
Exactly! Tally marking is a helpful method for this. Can you think of how we'd represent the data visually?
Yes! We could create a frequency histogram!
Very good! Remember, frequencies tell us how many observations fall within each class, revealing trends.
That really helps when analyzing large sets of data.
Understanding Class Marks
🔒 Unlock Audio Lesson
Sign up and enroll to listen to this audio lesson
As we use class marks for calculations, what do you think is the downside of this method?
Isn't it that you lose the exact values of individual data points?
Yes! This is sometimes referred to as loss of information. While classes simplify the data, they might hide some details.
So, we need to balance simplicity with detail?
Spot on! Always aim for clarity while ensuring you don't oversimplify. Now, let’s summarize what we learned.
Recap and Application
🔒 Unlock Audio Lesson
Sign up and enroll to listen to this audio lesson
To conclude, can anyone give me an example of how frequency distributions are used in real life?
They’re used in surveys to analyze people's responses!
Absolutely! They help businesses understand customer preferences or demographics. Remember the acronym S.U.R.V.E.Y. - 'Statistical Understanding Revealed via Visual and Engaging Yields!'
That’s helpful! I’m going to remember that.
Fantastic! Make sure you grasp these concepts well because they’re foundational for more advanced statistics.
Introduction & Overview
Read summaries of the section's main ideas at different levels of detail.
Quick Overview
Standard
The section outlines the process of preparing a frequency distribution by classifying raw data into organized intervals, providing a framework for statistical analysis. It emphasizes various classification methods, techniques for determining class limits, and the importance of both continuous and discrete variables.
Detailed
Detailed Summary
This section focuses on the preparation of a frequency distribution, which is essential for analyzing and interpreting raw data systematically. Frequency distribution helps us present collected data in a manner that is easy to understand and analyze. The preparation involves the following critical steps:
- Equal vs. Unequal Class Intervals: The choice between using equal-sized or unequal-sized class intervals depends on the nature of the data. Equal classes are commonly used when the range of data is manageable, while unequal classes might be beneficial when dealing with variables showcasing significant diversity like income levels.
- Number of Classes: Generally, the number of classes should be between 6 and 15. This can be calculated by dividing the range (the difference between the largest and smallest values) by the desired class interval size.
- Class Size: The size of each class should be determined based on the range of data. Class intervals can be inclusive or exclusive, affecting how values at the boundaries are treated.
- Calculating Frequencies: Frequencies are determined by counting the number of observations that fall into each class. Tally marking is a common technique used to keep track of counts.
- Using Class Marks: Once the classes are established, the class mark (midpoint of class intervals) is used for any further statistical calculations. This method embodies a trade-off as individual observation details are lost in favor of broader trends in the data.
The significance of creating a frequency distribution lies in its ability to simplify large datasets, revealing patterns and aiding in data interpretation for statistical analyses.
Youtube Videos


Audio Book
Dive deep into the subject with an immersive audiobook experience.
Introduction to Frequency Distribution
Chapter 1 of 5
🔒 Unlock Audio Chapter
Sign up and enroll to access the full audio experience
Chapter Content
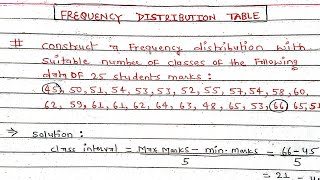
A frequency distribution is a comprehensive way to classify raw data of a quantitative variable. It shows how different values of a variable (here, the marks in mathematics scored by a student) are distributed in different classes along with their corresponding class frequencies.
Detailed Explanation
A frequency distribution organizes raw data into a simpler table format. It breaks down a large amount of data into manageable groups called classes, and counts how many values fall into each class, known as the frequency. This helps in understanding how the data are spread out and highlights key features, such as where most data points are clustered.
Examples & Analogies
Think of a teacher who needs to quickly assess student performance. Instead of looking at each student's mark individually, she groups the marks into ranges (e.g., 0-10, 10-20, etc.) and counts how many students scored in each range. This way, she can quickly see how many students did well and how many struggled, making it easier to understand the overall class performance.
Questions to Guide Preparation
Chapter 2 of 5
🔒 Unlock Audio Chapter
Sign up and enroll to access the full audio experience
Chapter Content
While preparing a frequency distribution, the following five questions need to be addressed: 1. Should we have equal or unequal sized class intervals? 2. How many classes should we have? 3. What should be the size of each class? 4. How should we determine the class limits? 5. How should we get the frequency for each class?
Detailed Explanation
These questions guide the process of building an efficient frequency distribution. The decision on whether to use equal or unequal classes can depend on the data's nature. Usually, having a manageable number of classes (about 6 to 15) is ideal. The size of the classes should reflect how the data clusters, and the class limits should be clearly defined to avoid confusion. Finally, frequencies can be determined through counting or tallying sensitive observations against each class.
Examples & Analogies
Imagine you are sorting a collection of marbles by size. Before you start, you need to decide: do you want to divide them into tall and short (unequal) or maybe sizes of 0-5 cm, 6-10 cm, etc. (equal)? Also, how many groups will you have? Thinking of these questions helps you categorize the marbles effectively.
Types of Class Intervals
Chapter 3 of 5
🔒 Unlock Audio Chapter
Sign up and enroll to access the full audio experience
Chapter Content
Class intervals are of two types: (i) Inclusive class intervals: where the values equal to the lower and upper limits of a class are included in the frequency of that same class. (ii) Exclusive class intervals: where an item equal to either the upper or the lower class limit is excluded from the frequency of that class.
Detailed Explanation
Understanding the types of class intervals is crucial when preparing a frequency distribution, as it helps define how to assign data points to classes. Inclusive intervals mean that the boundary numbers belong to the class, while exclusive intervals only allow values within the range, excluding the boundary values themselves. This can affect the frequency count of each class.
Examples & Analogies
If you're measuring the number of people who are aged 20-30, in an exclusive method, someone who is exactly 30 years old wouldn't be counted in that class. Conversely, in an inclusive method, they would be counted. Imagine organizing people into age groups at a party; it’s important to decide who fits where based on the intervals you choose.
Determining Class Frequency
Chapter 4 of 5
🔒 Unlock Audio Chapter
Sign up and enroll to access the full audio experience
Chapter Content
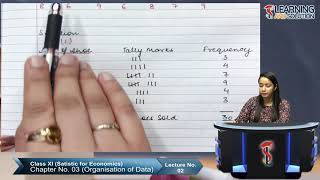
Frequency refers to the number of values in a particular class. The counting of tally is made easier when four of them are put as // and the fifth tally is placed across them as |. Tallies are then counted as groups of five.
Detailed Explanation
Class frequency is determined by counting how many data points fall within each class interval. Tally marks provide a visual method for counting, making it easy to keep track without losing count. After collecting tally marks, you can derive the total frequency for each class, which summarizes how many observations fit into each category.
Examples & Analogies
Imagine you're counting how many times your friends choose different ice cream flavors. Every time someone orders a flavor, you make a tally mark. Once you have four marks for a flavor, you cross them with a fifth mark to make counting easy. When you're done, you can quickly see which flavor was the most popular.
Loss of Information in Classification
Chapter 5 of 5
🔒 Unlock Audio Chapter
Sign up and enroll to access the full audio experience
Chapter Content
The classification of data as a frequency distribution has an inherent shortcoming. While it summarizes the raw data making it concise and comprehensible, it does not show the details that are found in raw data.
Detailed Explanation
Although frequency distributions simplify data and highlight key patterns, they inevitably lose the granularity of the information. For instance, if a class contains a wide range of values, all those values are summarized by a single class mark instead of being represented individually. This can lead to a loss of insight that could be critical for deeper analysis.
Examples & Analogies
Think of a survey where you count how many students are under different score ranges in an exam. While it helps see the trend, you lose the individual scores of those students. If you’d like to know who struggled and who excelled, you’d miss out by only looking at the aggregated results.
Key Concepts
-
Class Intervals: Groups of data points that share similar values.
-
Tally Marking: A technique for counting frequency.
-
Class Mark: The midpoint of class intervals used for calculations.
-
Continuous vs. Discrete Variables: Types of data that influence frequency distribution.
Examples & Applications
Example of how to create frequency classes for students' exam scores, illustrating equal class interval use.
Illustration of using unequal classes to represent income levels.
Memory Aids
Interactive tools to help you remember key concepts
Rhymes
Class it, tab it, count it right, frequency distributions shine so bright!
Stories
Imagine a librarian organizing books on a shelf. Instead of scattering them, she groups them by genre. This grouping helps readers find books quickly, much like we find trends in organized data.
Memory Tools
To remember the steps of creating frequency distributions: C.L.A.S.S. - Choose intervals, Locate class size, Arrange counts, Sort results, Summarize.
Acronyms
F.D. - Frequency Distribution, Fun and Dynamic way to visualize data!
Flash Cards
Glossary
- Frequency Distribution
A method of organizing raw data into classes to show how different values are distributed.
- Class Interval
A category of values that groups observations together for analysis.
- Class Mark
The midpoint of a class interval, used for calculations instead of raw data.
- Tally Marking
A counting method used to keep track of the frequency of data points in each class.
- Continuous Variable
A variable that can take any value within a given range.
- Discrete Variable
A variable that can only take specific values (often whole numbers).
Reference links
Supplementary resources to enhance your learning experience.