
Frequency distribution with unequal classes
Enroll to start learning
You’ve not yet enrolled in this course. Please enroll for free to listen to audio lessons, classroom podcasts and take practice test.
Interactive Audio Lesson
Listen to a student-teacher conversation explaining the topic in a relatable way.
Introduction to Frequency Distributions
🔒 Unlock Audio Lesson
Sign up and enroll to listen to this audio lesson

Today, we will discuss frequency distributions. Can anyone tell me why organizing data is important?

It helps us understand large amounts of information more clearly!
Exactly! When we group data into classes, we make it more manageable. Now, who can explain what a frequency distribution is?

It's a way to show how often each range of data occurs!
Great! Remember, we can have equal or unequal classes in our frequency distributions. We'll focus on unequal classes today. Why might we use unequal classes?

Maybe because some data is more concentrated in certain areas?
Exactly! Now let's summarize our key points: frequency distributions simplify data understanding and can be structured with either equal or unequal intervals based on data concentration.
Constructing Frequency Distributions
🔒 Unlock Audio Lesson
Sign up and enroll to listen to this audio lesson

Let's move forward. How do we construct a frequency distribution?

Do we just group the data into ranges?
Yes! But we also have to consider the appropriate class width. Let's look at an example. If we have students’ marks, should we use equal or unequal classes?
Unequal, if the grades are really spread out!
Excellent! Now, who can help me calculate the frequencies for our next class of marks from the earlier distribution?
If we have marks between 40 and 50, we can count how many students fall into that class!
Correct, how about we summarize that? Remember to consider the class intervals corresponding closely to the data values.
Losing Information vs. Organizing Data
🔒 Unlock Audio Lesson
Sign up and enroll to listen to this audio lesson
Now let's discuss a critical point: while organizing data can be helpful, there's a trade-off. What do you think we lose when we classify raw data?
We lose the specific details of each data point!
Precisely! Although we make data easier to interpret, we sacrifice individual variability by relying on class marks. Who remembers the example with the students' scores?
The scores were grouped into classes, which meant we used the average score instead of all individual scores.
Exactly! Now, let's summarize this concept: when grouping data, we make analysis simpler, but we may overlook some details of the original dataset.
Understanding Bivariate Frequency Distributions
🔒 Unlock Audio Lesson
Sign up and enroll to listen to this audio lesson
Finally, let's talk about bivariate frequency distributions. How can analyzing two variables be beneficial?
It can show relationships between two sets of data!
Right! For example, if we check sales and advertising expenditures, we can uncover trends or patterns. What could we do with such data?
We can predict how much we might earn based on how much we spend on ads!
Exactly! So, let's recap: bivariate distributions allow us to analyze relationships and derive more informative insights from our datasets.
Introduction & Overview
Read summaries of the section's main ideas at different levels of detail.
Quick Overview
Standard
This section explores frequency distributions, particularly those with unequal class intervals. It explains how these distributions provide a more accurate representation of data, particularly when key values need to be highlighted. Real-life examples and activities reinforce the understanding and application of these concepts.
Detailed
Frequency Distribution with Unequal Classes
In this section, we delve into the concept of frequency distributions, focusing specifically on those with unequal class intervals. Frequency distributions are vital tools in statistics, allowing data to be organized to reflect its frequency of occurrence in specific ranges effectively. Typically, equal class intervals are employed; however, there are situations where unequal intervals are more beneficial.
Key Concepts
-
Nature of Data Representation
Unequal class intervals help in accurately representing data when the concentration of observations varies significantly across different ranges. For example, income data often ranges broadly, where a few may earn much more than most, necessitating uneven class widths to capture meaningful insights. -
Data Organization
This section illustrates how to structure the data with appropriate classes—crediting examples like students' mathematical scores to depict frequency. -
Loss of Information
While frequency distributions make data manageable, classifying it inherently leads to some loss of specificity. For example, within class marks, individual scores contribute less because methods rely on aggregated class midpoints. -
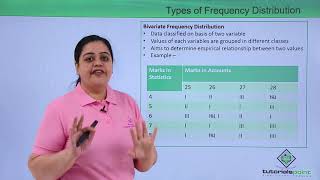
Bivariate Frequency Distributions
Lastly, an introduction to bivariate frequency distributions presents the notion of analyzing two variables simultaneously, which can unveil relationships not apparent in univariate analyses.
The lessons learned here are instrumental in transforming raw data into insightful statistical representations, ultimately aiding in drawing conclusions and making informed decisions based on data.
Youtube Videos


Audio Book
Dive deep into the subject with an immersive audiobook experience.
Introduction to Frequency Distributions with Unequal Classes
Chapter 1 of 4
🔒 Unlock Audio Chapter
Sign up and enroll to access the full audio experience
Chapter Content
By now you are familiar with frequency distributions of equal class intervals. You know how they are constructed out of raw data. But in some cases frequency distributions with unequal class intervals are more appropriate.
Detailed Explanation
This section begins by highlighting the distinction between frequency distributions with equal classes and those with unequal classes. While distributions with equal classes can effectively summarize raw data, there are instances where using unequal class intervals provides a more accurate representation of the data, particularly when data is unevenly distributed.
Examples & Analogies
Think of categorizing books in a library. If you have a lot of books on history and very few on science fiction, it wouldn't make sense to group them all in equal-sized sections. Instead, bigger sections could be allocated to history, while science fiction could have a smaller section. This showcases how some categories need more space to reflect their abundance.
Benefits of Using Unequal Classes
Chapter 2 of 4
🔒 Unlock Audio Chapter
Sign up and enroll to access the full audio experience
Chapter Content
If you observe the frequency distribution of Example 4, as in Table 3.6, you will notice that observations in these classes deviate more from their respective class marks than in comparison to those in other classes.
Detailed Explanation
In this chunk, it is discussed that when there are unequal classes, the class marks may not represent the data accurately if the observations significantly vary within those classes. Unequal classes can provide a clearer picture of how data is spread out and allow for better insights, especially if many observations cluster around certain values.
Examples & Analogies
Consider a bakery that sells types of cookies. If they sell thousands of chocolate chip cookies, but only a few oatmeal ones, using equal-sized categories for both would undervalue the popularity of chocolate chip cookies. By giving chocolate chip cookies a broader category, the data gives a more realistic view of cookie sales.
Constructing Frequency Distributions with Unequal Classes
Chapter 3 of 4
🔒 Unlock Audio Chapter
Sign up and enroll to access the full audio experience
Chapter Content
Table 3.7 shows the same frequency distribution of Table 3.6 in terms of unequal classes. Each of the classes 40–50, 50–60, and 60–70 are split into two-class intervals for better representation.
Detailed Explanation
Here, an example is provided in the form of Table 3.7, where existing classes are divided into smaller intervals. This reflects a common practice in data analysis where you might want to create subcategories to better capture where most of the data points lie. By breaking down larger classes into smaller, related segments, it's easier to analyze data characteristics.
Examples & Analogies
Imagine you're sorting fruits at a market. If you categorize your apples into just two groups—'Small Apples' and 'Large Apples'—you might miss out on a lot of detailed preferences from buyers who may be looking for medium-sized apples specifically. By further categorizing into 'Small', 'Medium', and 'Large', you get a clearer picture of what customers want.
Using Class Marks in Calculations
Chapter 4 of 4
🔒 Unlock Audio Chapter
Sign up and enroll to access the full audio experience
Chapter Content
In a Frequency Distribution, further statistical calculations are based only on the class mark values instead of values of the observations.
Detailed Explanation
In this part of the section, it becomes clear that when analyzing data in frequency distributions, statisticians typically use class marks—representative values of the class—rather than considering every individual observation within those classes. This streamlines calculations and is a standard approach in statistical analysis.
Examples & Analogies
This can be likened to classifying plants in a garden based on their height. Instead of measuring the height of each single plant, you could categorize the plants by height—like 'short', 'medium', 'tall'—and use the average height for each category to generalize. This simplification allows for a quicker assessment while retaining essential insights.
Key Concepts
-
Nature of Data Representation
-
Unequal class intervals help in accurately representing data when the concentration of observations varies significantly across different ranges. For example, income data often ranges broadly, where a few may earn much more than most, necessitating uneven class widths to capture meaningful insights.
-
Data Organization
-
This section illustrates how to structure the data with appropriate classes—crediting examples like students' mathematical scores to depict frequency.
-
Loss of Information
-
While frequency distributions make data manageable, classifying it inherently leads to some loss of specificity. For example, within class marks, individual scores contribute less because methods rely on aggregated class midpoints.
-
Bivariate Frequency Distributions
-
Lastly, an introduction to bivariate frequency distributions presents the notion of analyzing two variables simultaneously, which can unveil relationships not apparent in univariate analyses.
-
The lessons learned here are instrumental in transforming raw data into insightful statistical representations, ultimately aiding in drawing conclusions and making informed decisions based on data.
Examples & Applications
A frequency distribution showing students' scores in mathematics divided into unequal classes to highlight ranges where students performed better.
Analyzing sales versus advertising spend through a bivariate frequency distribution to find correlation.
Memory Aids
Interactive tools to help you remember key concepts
Rhymes
Organizing data with ease, helps us notice trends, don’t you see?
Stories
Imagine a librarian sorting books into sections: unequal sizes help her find the right one quickly, just like frequency distributions help us find data insights.
Memory Tools
C.U.B.E. - Concentration, Unequal, Bivariate, Easy! To remember key concepts in frequency distributions.
Acronyms
F.A.C.E. - Frequency, Adjustment, Class, Equal/Unequal to identify important aspects.
Flash Cards
Glossary
- Frequency Distribution
A method of organizing data by counting how many times each value appears in specified intervals.
- Equal Classes
Frequency distributions where each class has the same interval or width.
- Unequal Classes
Frequency distributions where classes have different intervals, often used when data range varies widely.
- Bivariate Distribution
A statistical distribution representing two variables.
- Class Mark
The midpoint of a class interval, used in frequency distributions for analysis.
Reference links
Supplementary resources to enhance your learning experience.