
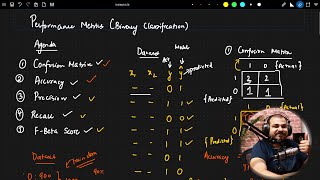
Classification Metrics
Enroll to start learning
You’ve not yet enrolled in this course. Please enroll for free to listen to audio lessons, classroom podcasts and take practice test.
Interactive Audio Lesson
Listen to a student-teacher conversation explaining the topic in a relatable way.
Understanding Accuracy
🔒 Unlock Audio Lesson
Sign up and enroll to listen to this audio lesson

Let's begin with **accuracy**. It measures how many predictions our model got right overall. Can anyone remind us of the formula for calculating accuracy?

I think it’s the number of true positives plus true negatives over the total number of predictions, right?
Exactly! It’s calculated as (TP + TN) / (TP + TN + FP + FN). But remember, accuracy can be misleading in imbalanced datasets. Why do you think that might be?

Because if one class is much more frequent, the model could predict that class all the time and still have high accuracy.
Great point! That's why we must look deeper at other metrics, especially in case of imbalance.
Diving into Precision and Recall
🔒 Unlock Audio Lesson
Sign up and enroll to listen to this audio lesson

Now, let’s explore **precision** and **recall**. Can anyone explain what precision measures?

Precision is the ratio of true positives to the total predicted positives. It helps determine false positives!
Exactly! And recall focuses on true positives versus actual positives. Can anyone give a real-world scenario where we care more about recall?

In medical diagnosis, we want to catch all cases of a disease. Missing one could be critical.
Spot on! In cases like these, **high recall** is crucial, even if that means having a lower precision.
The F1-Score
🔒 Unlock Audio Lesson
Sign up and enroll to listen to this audio lesson
Now that we know about precision and recall, let’s talk about the **F1-score**. Who can summarize what it represents?
It's the harmonic mean of precision and recall, so it balances them out when there's a trade-off!
That’s correct! The F1-score is particularly useful when we have imbalanced datasets because it gives a better sense of the model’s performance than accuracy alone.
So if I’m tuning my model, I should prioritize maximizing the F1-score when classes are imbalanced?
Absolutely! Remember, F1-score is a crucial metric in such situations.
ROC-AUC and Log Loss
🔒 Unlock Audio Lesson
Sign up and enroll to listen to this audio lesson
Let's wrap up with the ROC-AUC and log loss. The ROC-AUC is key for understanding model discrimination. What does it plot?
It plots true positive rates against false positive rates at different thresholds!
Correct! The area under this curve helps us understand how well our model differentiates between classes. And what about log loss?
Log loss penalizes wrong confident predictions. If a model is sure and wrong, it gets hit hard!
Exactly! It's essential for models where we care about the probabilities, not just the classifications!
Introduction & Overview
Read summaries of the section's main ideas at different levels of detail.
Quick Overview
Standard
Classification metrics are essential tools for assessing how well machine learning models perform. Key metrics discussed include accuracy, precision, recall, F1-score, ROC-AUC, and log loss, each serving a specific purpose in understanding model efficacy, especially in scenarios with imbalanced datasets.
Detailed
Classification Metrics in Machine Learning
Machine learning classification models require effective metrics to evaluate their performance objectively. This section explores essential classification metrics that provide insights into model performance. The accuracy of a model indicates overall correctness, calculated as the ratio of correct predictions (true positives and true negatives) to total predictions. However, accuracy can be misleading, especially in datasets with imbalanced class distributions, where metrics like precision and recall become vital.
- Precision measures the ratio of true positives to the total number of predicted positives, emphasizing the importance of minimizing false positives.
- Recall, or sensitivity, focuses on the ratio of true positives to the actual positives, highlighting the need to capture all relevant instances of a class while minimizing false negatives.
- The F1-score combines precision and recall into a single metric using the harmonic mean, making it particularly useful for imbalanced datasets.
- ROC-AUC measures a model's discrimination ability by plotting true positives versus false positives at various thresholds. Its area under the curve provides a measure of model performance across all classification thresholds.
- Log loss evaluates a model’s performance based on the probabilities of predicted outcomes, heavily penalizing incorrect confident predictions, thus encouraging models to provide more calibrated probabilities.
These metrics are crucial not only for evaluating model effectiveness but also for guiding the tuning of hyperparameters and avoiding pitfalls like overfitting.
Youtube Videos

Audio Book
Dive deep into the subject with an immersive audiobook experience.
Accuracy
Chapter 1 of 7
🔒 Unlock Audio Chapter
Sign up and enroll to access the full audio experience
Chapter Content
Accuracy
Formula: (TP + TN) / (TP + TN + FP + FN)
Interpretation: Overall correctness
Detailed Explanation
Accuracy is a metric that represents the overall correctness of a model. It is calculated by taking the sum of true positives (TP) and true negatives (TN) and dividing it by the total number of predictions (the sum of TP, TN, false positives (FP), and false negatives (FN)). A high accuracy indicates that the model is making the right predictions most of the time.
Examples & Analogies
Think of accuracy like a student’s grade in a class. If a student answers 80 out of 100 questions correctly, their accuracy (grade) would be 80%. However, it doesn't tell us how they performed on different types of questions.
Precision
Chapter 2 of 7
🔒 Unlock Audio Chapter
Sign up and enroll to access the full audio experience
Chapter Content
Precision
Formula: TP / (TP + FP)
Interpretation: Focuses on false positives
Detailed Explanation
Precision is a metric that helps us understand how many of the predicted positive instances were actually correct. It is calculated as the number of true positives divided by the sum of true positives and false positives. A high precision means that when the model predicts a positive result, it is likely to be correct.
Examples & Analogies
Imagine a doctor diagnosing a disease. Precision would be the ratio of patients correctly diagnosed with the disease to all patients diagnosed (including those who don’t have it). High precision means the doctor rarely misdiagnoses healthy patients.
Recall
Chapter 3 of 7
🔒 Unlock Audio Chapter
Sign up and enroll to access the full audio experience
Chapter Content
Recall
Formula: TP / (TP + FN)
Interpretation: Focuses on false negatives (Sensitivity)
Detailed Explanation
Recall, also known as sensitivity, measures how well a model identifies positive classes. It is calculated as the number of true positives divided by the sum of true positives and false negatives. High recall means the model captures most of the actual positive instances.
Examples & Analogies
Think of a fire alarm system. Recall would represent the ability of the alarm system to detect actual fires (true positives) against the number of fires that occurred (true positives plus missed fires or false negatives). A high recall means very few fires go undetected.
F1-Score
Chapter 4 of 7
🔒 Unlock Audio Chapter
Sign up and enroll to access the full audio experience
Chapter Content
F1-Score
Formula: 2 * (Precision * Recall) / (Precision + Recall)
Interpretation: Harmonic mean of Precision and Recall
Detailed Explanation
The F1-Score is a balanced measure that takes both precision and recall into account, making it useful when you have an imbalanced class distribution. It is calculated as the harmonic mean of precision and recall. A high F1-Score indicates that the model has a good balance between precision and recall.
Examples & Analogies
Consider a soccer player who scores goals (true positives) and misses opportunities (false negatives) and how often they miss when trying to score. The F1-Score is like finding the right balance between the player's scoring ability (precision) and their chances of scoring (recall). A player needs to score enough while not missing too many opportunities to maintain a good performance.
ROC-AUC
Chapter 5 of 7
🔒 Unlock Audio Chapter
Sign up and enroll to access the full audio experience
Chapter Content
ROC-AUC
Formula: Area under ROC Curve
Interpretation: Measures model discrimination ability
Detailed Explanation
ROC-AUC is a single number that captures the performance of a classification model across all classification thresholds. The ROC curve plots the true positive rate (sensitivity) against the false positive rate at various threshold settings. The area under the ROC curve (AUC) provides an aggregate measure of performance. A small AUC (close to 0.5) suggests that the model has poor discrimination ability, while an AUC of 1.0 indicates perfect discrimination.
Examples & Analogies
Imagine a security system that needs to distinguish between intruders and harmless visitors. The ROC-AUC is like a thoroughness score: a score of 1 indicates every intruder is caught while letting all harmless visitors in, whereas 0.5 suggests it might as well guess randomly, accepting some intruders.
Log Loss
Chapter 6 of 7
🔒 Unlock Audio Chapter
Sign up and enroll to access the full audio experience
Chapter Content
Log Loss
Formula: -[y log(p) + (1-y) log(1-p)]
Interpretation: Penalizes wrong confident predictions
Detailed Explanation
Log Loss is a performance measure for classifiers where the output is a probability value between 0 and 1. It measures the uncertainty of the predictions based on how confident the model is about its predictions. The goal is to minimize the log loss. Lower log loss indicates better model accuracy on the dataset. It penalizes predictions that are confident but wrong more heavily.
Examples & Analogies
Consider a weather forecast that predicts rain. If it predicts a 90% chance of rain but it doesn’t rain, that forecast would be penalized heavily by log loss because it was very confident in its prediction yet very wrong. If it predicted only a 50% chance of rain, the penalty would be less severe.
Tip for Imbalanced Datasets
Chapter 7 of 7
🔒 Unlock Audio Chapter
Sign up and enroll to access the full audio experience
Chapter Content
Tip: Use F1-Score for imbalanced datasets.
Detailed Explanation
When dealing with imbalanced datasets, accuracy can be misleading. An F1-Score is preferred as it considers both precision and recall, thus providing a better overall picture of model performance. It effectively captures the balance between false positives and false negatives, which is crucial in avoiding misleading conclusions from high accuracy values.
Examples & Analogies
Imagine a factory producing a large number of perfectly fine widgets, but a few are defective. If you just check who gets defective labels and measure accuracy, you may think everything is fine when in fact the few defective ones need more attention. The F1-Score helps get the true picture of how well you perform in identifying defects, not just production levels.
Key Concepts
-
Accuracy: Overall correctness of the model.
-
Precision: Measurement of true positives among predicted positives.
-
Recall: Measurement of true positives among actual positives.
-
F1-Score: Harmonic mean of precision and recall.
-
ROC-AUC: Represents model discrimination ability.
-
Log Loss: Penalizes incorrect confident predictions.
Examples & Applications
For a classifier predicting spam emails, accuracy might be high due to the majority class of non-spam, but precision and recall give better insights into performance.
A medical screening test for a rare disease may have high accuracy but low recall if it misses many actual positive cases.
The F1-score helps to understand the balance between precision and recall when false positives and negatives carry different costs.
When evaluating a model, ROC-AUC provides a visual tool to compare performance at different thresholds, particularly useful for binary classification.
Memory Aids
Interactive tools to help you remember key concepts
Rhymes
To know if our model is right, accuracy gives us the sight. But beware of the fake, imbalanced might shake!
Stories
Imagine a doctor using a test. If they only check if you're sick and avoid false positives, how many healthy go unchecked? That’s how recall works – finding all the sick among the healthy.
Memory Tools
To remember precision and recall: 'Precise Pecks can Recall Ripe.' Precision counts what you get, recall ensures you don’t forget what’s set.
Acronyms
F1
Feel First-rate with F1! First-rate accuracy and recall leads to top-notch success.
Flash Cards
Glossary
- Accuracy
Overall correctness of a model, calculated as (TP + TN) / (TP + TN + FP + FN).
- Precision
The ratio of true positives to the total number of predicted positives.
- Recall
The ratio of true positives to the actual positives, also known as sensitivity.
- F1Score
The harmonic mean of precision and recall, useful for imbalanced datasets.
- ROCAUC
Area under the ROC Curve; measures the model's discrimination ability.
- Log Loss
A metric penalizing the model for wrong confident predictions, encouraging calibrated probabilities.
Reference links
Supplementary resources to enhance your learning experience.