
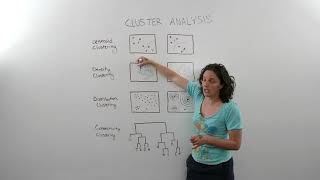
Types of Clustering Algorithms
Enroll to start learning
You’ve not yet enrolled in this course. Please enroll for free to listen to audio lessons, classroom podcasts and take practice test.
Interactive Audio Lesson
Listen to a student-teacher conversation explaining the topic in a relatable way.
K-Means Clustering
🔒 Unlock Audio Lesson
Sign up and enroll to listen to this audio lesson

Let's start with K-Means Clustering. This algorithm partitions a dataset into K distinct clusters based on their features. Can anyone tell me what the term 'centroid' means in this context?

Is it the center point of a cluster?
Correct! The centroid is the mean of the data points in a cluster. Now, K-Means works by initializing K centroids, and the algorithm repeats assigning points to the nearest centroid and updating the centroid until convergence. What do you think is a pro and a con of this algorithm?

It’s simple and fast to compute, but requires specifying K beforehand.
Well done! It also struggles with outliers. A simple way to remember K-Means is 'Centroid K', since it's centered around K clusters. Let's move on.
Hierarchical Clustering
🔒 Unlock Audio Lesson
Sign up and enroll to listen to this audio lesson

Now, let's look at Hierarchical Clustering, which creates a tree-like structure called a dendrogram. Can anyone describe the two approaches to this method?

There is agglomerative and divisive clustering, right?
Exactly! Agglomerative starts with individual points and merges them, while divisive begins with one cluster and divides it. What’s an advantage of this approach?

You don’t need to specify the number of clusters beforehand?
Correct! But remember, it can be computationally intensive. Think of Hierarchical Clustering as a family tree of clusters. Let’s summarize what we learned.
DBSCAN
🔒 Unlock Audio Lesson
Sign up and enroll to listen to this audio lesson
Lastly, we have DBSCAN or Density-Based Spatial Clustering. Can someone explain how DBSCAN works?
It groups points that are closely packed together while marking points in low-density areas as outliers.
That’s right! It uses parameters like epsilon and minPts to define density. What are some advantages and disadvantages of DBSCAN?
It’s good for detecting arbitrary shapes and is robust to outliers, but tuning parameters can be tricky.
Excellent points! A way to remember this is 'Density Clusters'. Now, let’s wrap up our session.
Introduction & Overview
Read summaries of the section's main ideas at different levels of detail.
Quick Overview
Standard
The section provides an overview of different clustering algorithms, detailing their methods, pros and cons, and respective applications. It highlights K-Means, Hierarchical Clustering, and DBSCAN as primary techniques in clustering, emphasizing how they group similar data points and the considerations needed when implementing them.
Detailed
Detailed Summary
In the realm of unsupervised learning, clustering serves as a pivotal technique to uncover the inherent structure of unlabeled datasets by grouping similar data points. This section elaborates on three primary types of clustering algorithms:
- K-Means Clustering: A centroid-based approach that partitions data into K clusters. It operates by initializing K centroids, assigning data points to the nearest centroid, and iterating between these steps until convergence. It's particularly suitable for spherical clusters but requires pre-defining K and is sensitive to outliers.
- Hierarchical Clustering: This method builds a dendrogram representation of clusters using either an agglomerative (bottom-up) or divisive (top-down) approach. Hierarchical clustering allows for flexible cluster number determination and is beneficial for exploring hierarchical relationships, though it's computationally intensive and less practical for large datasets.
- DBSCAN (Density-Based Spatial Clustering of Applications with Noise): This algorithm identifies clusters based on dense regions of data. It avoids specifying the number of clusters beforehand and can find arbitrarily shaped clusters while being robust to outliers. However, it faces challenges with parameter tuning and varying data densities.
By exploring these methods, the section underlines their applications across various domains, such as market segmentation and anomaly detection, reinforcing their significance in extracting meaningful patterns from structured data.
Youtube Videos

Audio Book
Dive deep into the subject with an immersive audiobook experience.
K-Means Clustering
Chapter 1 of 3
🔒 Unlock Audio Chapter
Sign up and enroll to access the full audio experience
Chapter Content
- K-Means Clustering
• A centroid-based algorithm that partitions the dataset into K clusters.
• Each cluster is represented by the centroid, which is the mean of the data points in that cluster.
Algorithm Steps:
1. Initialize K centroids randomly.
2. Assign each data point to the nearest centroid.
3. Update centroids as the mean of the assigned points.
4. Repeat steps 2 and 3 until convergence.
Mathematical Objective:
Minimize the within-cluster sum of squares (WCSS):
𝑘
∑ ∑ ∥𝑥 −𝜇 ∥2
𝑗 𝑖
𝑖=1𝑥 ∈𝐶
𝑗 𝑖
Where:
• 𝐶 : set of points in cluster 𝑖
𝑖
• 𝜇 : centroid of cluster 𝑖
𝑖
Pros:
• Simple and fast.
• Works well with spherical clusters.
Cons:
• Requires pre-defining K.
• Sensitive to outliers and initial values.
Detailed Explanation
K-Means Clustering is a popular algorithm used for partitioning a dataset into a specified number of clusters, denoted as K. The main idea is to represent each cluster by a centroid, which is simply the average of all points within that cluster. The algorithm works in the following steps: first, you randomly choose K starting centroids. Next, each data point is assigned to the closest centroid based on distance. After assigning all points, the centroids are updated to be the mean position of those points. This process repeats until the centroids no longer change significantly, indicating that the algorithm has converged. The mathematical goal here is to minimize the 'within-cluster sum of squares' (WCSS), which measures how tightly grouped the data points in each cluster are. One of the advantages of K-Means is its simplicity and speed, especially when clusters are spherical in shape. However, it requires you to predefine the number of clusters, K, and it can be sensitive to outliers and the initial choice of centroids.
Examples & Analogies
Imagine you are trying to form sports teams from a large group of kids based on their skill levels. You decide in advance you want to form 3 teams (K=3). To start, you randomly select 3 kids to represent these teams. Each kid is assigned to the team whose captain is the closest in skill level. After all kids are assigned, you take the average skill level of each team and choose new captains based on this average. You repeat these steps until kids stop switching teams. In this way, you have efficiently grouped the kids into teams while ensuring each team's players are as similar in skill as possible.
Hierarchical Clustering
Chapter 2 of 3
🔒 Unlock Audio Chapter
Sign up and enroll to access the full audio experience
Chapter Content
- Hierarchical Clustering
• Builds a tree (dendrogram) of clusters.
• Two approaches:
o Agglomerative (bottom-up): Each point starts as its own cluster, and pairs are merged.
o Divisive (top-down): Start with one cluster and recursively split it.
Linkage Criteria:
• Single linkage: Minimum distance between points.
• Complete linkage: Maximum distance.
• Average linkage: Average pairwise distance.
Pros:
• No need to specify number of clusters in advance.
• Good for hierarchical relationships.
Cons:
• Computationally intensive (O(n²) or more).
• Not suitable for very large datasets.
Detailed Explanation
Hierarchical Clustering is a method that builds a hierarchy of clusters, typically represented as a dendrogram, a tree-like diagram that illustrates the arrangement of the clusters. There are two main approaches: 1) Agglomerative, where each individual data point starts as its own cluster and pairs of clusters are merged together based on a similarity measure, and 2) Divisive, where the process starts with a single cluster that contains all data points and recursively splits it into smaller clusters. To determine how clusters are combined or split, several 'linkage criteria' are used — for example, single linkage measures the minimum distance between points in the clusters, while complete linkage measures the maximum distance. The choice of linkage affects the shape and structure of the resulting clusters. One benefit of hierarchical clustering is that you don’t need to pre-specify the number of clusters; however, the approach can be computationally intensive and less practical for large datasets due to its O(n²) complexity.
Examples & Analogies
Think of a family tree where each person represents data points. You start with all family members at the base level, where each individual is a cluster. As you explore relationships, you start grouping individuals into families based on direct lineage (like merging them based on proximity). Eventually, you can observe larger family groups being formed at different levels. Agglomerative clustering resembles this process as individual family members combine to create families, while divisive clustering would be like starting with the entire tree and breaking it down into smaller families. This tree allows you to visualize the family relationships easily, much like how a dendrogram visualizes clusters.
DBSCAN
Chapter 3 of 3
🔒 Unlock Audio Chapter
Sign up and enroll to access the full audio experience
Chapter Content
- DBSCAN (Density-Based Spatial Clustering of Applications with Noise)
• Groups data points that are densely packed together.
• Points in low-density regions are considered outliers.
Parameters:
• 𝜀 (eps): Radius for neighborhood search.
• minPts: Minimum number of points required to form a dense region.
Advantages:
• Detects arbitrary-shaped clusters.
• Robust to outliers.
Disadvantages:
• Parameter tuning can be difficult.
• Struggles with varying densities.
Detailed Explanation
DBSCAN, which stands for Density-Based Spatial Clustering of Applications with Noise, is a clustering algorithm that identifies clusters through the density of data points in space. It works by defining a neighborhood around each point with a specified radius, represented as 𝜀 (epsilon). The algorithm requires two parameters: 𝜀, which determines how far out to search for neighboring points, and minPts, the minimum number of points required to consider a region as a dense area. DBSCAN tends to find clusters that have arbitrary shapes instead of requiring them to be circular or spherical. Moreover, it can effectively identify outliers as points in low-density areas that do not meet the minPts requirement. However, parameter tuning can be quite challenging, and the algorithm may struggle with datasets that have varying densities since the same 𝜀 value might not work well across different regions.
Examples & Analogies
Consider a city map dotted with coffee shops and restaurants. DBSCAN can be likened to a neighborhood exploration strategy where you identify areas with many coffee shops (dense neighborhoods) and note any isolated shops (outliers) that don’t cluster with others. You decide that a ‘good’ area should have at least 5 coffee shops (minPts) within a 100-meter radius (𝜀). By wandering through the city, you can quickly identify bustling coffee streets (clusters) and areas where shops are too far apart to form a community (outliers). This method allows you to map out popular spots based solely on the coffee shop density, regardless of their exact layout on the map.
Key Concepts
-
K-Means Clustering: A method of partitioning data points into K clusters based on proximity to centroids.
-
Hierarchical Clustering: A technique that produces a tree representation of clusters.
-
DBSCAN: A density-based clustering algorithm that identifies arbitrarily shaped clusters.
Examples & Applications
K-Means can be used in customer segmentation, where customers are grouped based on purchasing behavior.
Hierarchical Clustering could be applied to organize documents in a library according to subject matter without predefined categories.
Memory Aids
Interactive tools to help you remember key concepts
Rhymes
K for K-Means, clusters so keen; centroids stay close, the best you've seen.
Stories
Imagine a librarian sorting books into piles based on topics without giving them labels. Each pile represents a cluster formed by similar themes, reflecting how K-Means works.
Memory Tools
For DBSCAN, 'Density Defines'. Remember: clusters emerge from dense areas.
Acronyms
In Hierarchical Clustering, think 'A-D' (Agglomerative-Divisive) to remember the two approaches.
Flash Cards
Glossary
- KMeans Clustering
A centroid-based algorithm that partitions data into K clusters based on feature similarities.
- Centroid
A point that represents the center of a cluster, usually calculated as the mean of data points in that cluster.
- Hierarchical Clustering
A clustering approach that builds a tree-like structure (dendrogram) to represent clusters.
- Dendrogram
A tree diagram that shows the arrangement of the clusters created by hierarchical clustering.
- DBSCAN
Density-Based Spatial Clustering of Applications with Noise, an algorithm that identifies clusters of varying shapes based on density.
Reference links
Supplementary resources to enhance your learning experience.