
Unsupervised Learning – Clustering & Dimensionality Reduction
Enroll to start learning
You’ve not yet enrolled in this course. Please enroll for free to listen to audio lessons, classroom podcasts and take practice test.
Interactive Audio Lesson
Listen to a student-teacher conversation explaining the topic in a relatable way.
Introduction to Unsupervised Learning
🔒 Unlock Audio Lesson
Sign up and enroll to listen to this audio lesson

Welcome class! Today, we'll explore unsupervised learning, which is crucial for uncovering hidden patterns in data without explicit labels. Can anyone tell me what unsupervised learning means?

Is it where we learn from data that doesn't have labels?
Exactly! The key objective is to find structure in latent data. What are the primary techniques that fall under unsupervised learning?

I think clustering and dimensionality reduction?
Correct! Clustering groups similar data points, while dimensionality reduction reduces feature count while preserving information. Let’s delve deeper into clustering next.
Clustering Techniques
🔒 Unlock Audio Lesson
Sign up and enroll to listen to this audio lesson

Today, we will discuss K-Means clustering first. Can anyone summarize how K-Means works?

It involves choosing K centroids, assigning points to the closest centroid, and then recalculating centroids?
Great job! This process repeats until the centroids stabilize. Remember, if we want to minimize the within-cluster sum of squares, we are aiming for optimal clustering. Now, what’s a downside of K-Means?

It requires us to choose K beforehand, right?
Absolutely! It can also be sensitive to outliers and initialization. Let’s compare that to hierarchical clustering next.
Dimensionality Reduction
🔒 Unlock Audio Lesson
Sign up and enroll to listen to this audio lesson
Now that we’ve covered clustering, let’s turn to dimensionality reduction. Why would we want to reduce dimensions?
To avoid the curse of dimensionality and make calculations easier!
Exactly! Another benefit is improved visualization. What is PCA and how does it help in dimensionality reduction?
PCA transforms original features into new uncorrelated variables, right?
Yes! And it emphasizes capturing variance in the data. But remember, it assumes linearity. t-SNE and UMAP are alternatives that can work better for visualization, especially with complex data.
Applications of Clustering and Dimensionality Reduction
🔒 Unlock Audio Lesson
Sign up and enroll to listen to this audio lesson
Let’s see where clustering and dimensionality reduction are used! Can anyone name a few applications?
Maybe in marketing for customer segmentation?
Exactly! Other applications include image processing, bioinformatics, and NLP. Why do you think these techniques are valuable in these fields?
They help us understand and group large datasets better, especially when we don't have labels.
Well said! This is how unsupervised learning enables deeper insights into diverse data.
Introduction & Overview
Read summaries of the section's main ideas at different levels of detail.
Quick Overview
Standard
This section delves into unsupervised learning, focusing on clustering methods such as K-Means, Hierarchical, and DBSCAN, as well as dimensionality reduction techniques like PCA, t-SNE, and UMAP. It explores their applications and practical significance in the field of machine learning.
Detailed
Unsupervised Learning – Clustering & Dimensionality Reduction
Unsupervised learning is a crucial aspect of machine learning, focused on analyzing unlabeled data to discover hidden patterns or structures. This section covers two primary techniques: clustering and dimensionality reduction.
Clustering
Clustering is the process of grouping similar data points into clusters based on feature similarities. Common algorithms include:
1. K-Means Clustering: Partitions data into K clusters using centroid-based algorithms. It involves initial centroid selection, assigning points, and iterating until convergence.
2. Hierarchical Clustering: Creates a dendrogram representing nested clusters through agglomerative and divisive methods. It doesn't require predefined clusters but is computationally intensive.
3. DBSCAN: Identifies dense regions of points separated by low-density areas, making it robust to outliers but challenging when tuning parameters.
Cluster evaluation metrics like the Silhouette Score and Davies-Bouldin Index help assess the effectiveness of the clustering method.
Dimensionality Reduction
Dimension reduction techniques help in reducing feature space to avoid the curse of dimensionality. Key methods include:
- PCA (Principal Component Analysis) captures maximum variance to project data onto a lower-dimensional space through linear transformations. However, it assumes linearity and may obscure interpretability.
- t-SNE focuses on visualizing clusters in lower dimensions while preserving local structures but is computationally intensive.
- UMAP offers a robust alternative that maintains both local and global structures while improving scaling.
The applications of clustering and dimensionality reduction span various fields, including marketing, biology, image processing, and natural language processing, enhancing insights and model performance.
Youtube Videos

Audio Book
Dive deep into the subject with an immersive audiobook experience.
Introduction to Unsupervised Learning
Chapter 1 of 9
🔒 Unlock Audio Chapter
Sign up and enroll to access the full audio experience
Chapter Content
Unsupervised learning is a key domain of machine learning where the model is trained on unlabeled data, i.e., the outcomes or target values are not provided. The primary goal is to uncover hidden patterns or structures from the input data. Two fundamental techniques in unsupervised learning are clustering and dimensionality reduction.
- Clustering involves grouping similar data points together based on their features.
- Dimensionality Reduction aims to reduce the number of features while preserving the data’s essential structure.
Detailed Explanation
Unsupervised learning is a form of machine learning where we don't provide the model with explicit answers or labels. Instead, the model explores the data to identify patterns or structures. The two primary techniques used in unsupervised learning are clustering and dimensionality reduction. Clustering helps in organizing data into groups with similar characteristics, while dimensionality reduction simplifies the data by reducing the number of variables without losing important information.
Examples & Analogies
Imagine you're sorting a box of mixed toys without knowing what each toy is called. Clustering would help you group similar toys together, like all the cars in one pile, all the dolls in another, and so on. Dimensionality reduction is like choosing to describe your toys with just a few key features, like size and color, instead of listing every detail about them.
What is Clustering?
Chapter 2 of 9
🔒 Unlock Audio Chapter
Sign up and enroll to access the full audio experience
Chapter Content
Clustering is the task of dividing a dataset into groups (called clusters) so that data points in the same cluster are more similar to each other than to those in other clusters. Real-world analogy: Think of organizing books in a library by topic, even if no labels are given — the grouping emerges from similarities.
Detailed Explanation
Clustering refers to the process of partitioning a dataset into distinct groups where the members of each group share common characteristics. The goal is to ensure that the data points within the same group (cluster) are more similar to one another than to those in other clusters. For example, in a library, books can be organized into groups based on themes such as fiction, non-fiction, or mystery, even though no specific labels are attached.
Examples & Analogies
Think of a fruit basket with various fruits like apples, bananas, and oranges. If we were to cluster these fruits, we might group all the apples together, all the bananas together, and so on. Even without labels, we naturally form clusters based on the noticeable similarities — like color, shape, and type.
Types of Clustering Algorithms
Chapter 3 of 9
🔒 Unlock Audio Chapter
Sign up and enroll to access the full audio experience
Chapter Content
- K-Means Clustering
- A centroid-based algorithm that partitions the dataset into K clusters.
- Each cluster is represented by the centroid, which is the mean of the data points in that cluster.
- Algorithm Steps:
- Initialize K centroids randomly.
- Assign each data point to the nearest centroid.
- Update centroids as the mean of the assigned points.
- Repeat steps 2 and 3 until convergence.
- Mathematical Objective: Minimize the within-cluster sum of squares (WCSS).
- Hierarchical Clustering
- Builds a tree (dendrogram) of clusters.
- Two approaches: Agglomerative (bottom-up) and Divisive (top-down).
- DBSCAN (Density-Based Spatial Clustering of Applications with Noise)
- Groups data points that are densely packed together.
- Points in low-density regions are considered outliers.
Detailed Explanation
There are several popular algorithms used for clustering:
1. K-Means Clustering: This algorithm creates 'K' clusters by first randomly initializing centroids. It then iteratively assigns data points to the nearest centroid and updates the centroid until the groups stabilize. The aim is to minimize the distance between data points and their respective centroid.
2. Hierarchical Clustering: This method builds a tree-like structure that represents clusters at different levels of granularity. It can be agglomerative, where clusters are merged, or divisive, where one cluster is divided into smaller clusters.
3. DBSCAN: This algorithm focuses on the density of data points, forming clusters in dense regions and marking sparse areas as outliers. This allows it to find clusters of various shapes and sizes.
Examples & Analogies
Imagine you're organizing a music playlist. Using K-Means could be like picking a certain number of categories, such as pop, rock, and jazz, and sorting songs into them. Hierarchical clustering could be visually represented as a family tree, where you group similar artists into branches. DBSCAN could work like a party where only the guests who know each other (dense clusters) stay together, while those who don't (outliers) stand alone.
Clustering Evaluation Metrics
Chapter 4 of 9
🔒 Unlock Audio Chapter
Sign up and enroll to access the full audio experience
Chapter Content
• Silhouette Score: Measures how similar a point is to its own cluster vs. other clusters. Ranges from -1 to 1.
• Davies-Bouldin Index: Lower values indicate better clustering.
• Elbow Method: Used to determine optimal K in K-Means by plotting WCSS vs. number of clusters.
Detailed Explanation
To assess the quality of clustering, several metrics are utilized:
- Silhouette Score quantifies how similar each point is to its own cluster compared to others. A score near 1 suggests that points are well-clustered, while a score close to -1 indicates points may be in the wrong cluster.
- Davies-Bouldin Index provides a measure of cluster separation, with lower values indicating better-defined clusters.
- The Elbow Method helps in selecting the optimal number of clusters (K) by plotting the WCSS against K, looking for a 'knee' in the graph where increasing K yields diminishing returns in cluster quality.
Examples & Analogies
Think of testing a new recipe. The Silhouette Score is like asking your friends if they can describe the dish and identify its unique flavors (similarities within the dish). The Davies-Bouldin Index is like comparing your dish to a buffet and seeing how distinctly it stands alone among other offerings. The Elbow Method is akin to experimenting with the quantity of ingredients until you find just the right balance before it becomes overcomplicated.
Dimensionality Reduction: Why Reduce Dimensions?
Chapter 5 of 9
🔒 Unlock Audio Chapter
Sign up and enroll to access the full audio experience
Chapter Content
• Curse of Dimensionality: More dimensions can lead to sparse data and degrade model performance.
• Reduces computational cost.
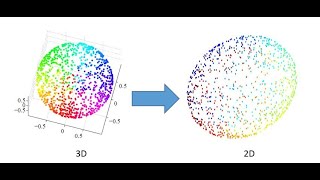
• Improves visualization (e.g., 2D or 3D plots).
Detailed Explanation
Dimensionality reduction is crucial for a few reasons:
- Curse of Dimensionality: In high-dimensional spaces, data points become sparse, making it challenging for algorithms to distinguish patterns. This can decrease model performance.
- By reducing the number of dimensions, we also lower the computational cost, making processing faster and more efficient.
- Lastly, fewer dimensions can improve visualization, allowing us to represent complex data in 2D or 3D plots where we can draw insights more readily.
Examples & Analogies
Consider an art gallery with numerous paintings (features). If you attempt to display all these paintings at once, visitors may feel overwhelmed (curse of dimensionality). By selecting a few key highlights for a special exhibition (dimensionality reduction), you enhance their experience, allowing them to appreciate the essence of your collection without confusion.
Principal Component Analysis (PCA)
Chapter 6 of 9
🔒 Unlock Audio Chapter
Sign up and enroll to access the full audio experience
Chapter Content
• A linear transformation technique.
• Transforms original features into a new set of uncorrelated variables called principal components.
• Captures the maximum variance in the data.
Mathematical Steps:
1. Standardize the data.
2. Compute the covariance matrix.
3. Calculate eigenvectors and eigenvalues.
4. Select top k eigenvectors.
5. Project data onto these vectors.
Detailed Explanation
Principal Component Analysis (PCA) is a method for dimensionality reduction that transforms the original features of the data into a new set of uncorrelated variables (principal components). The goal is to capture the maximum variance in the data using as few components as possible. The process involves standardizing the data, computing the covariance matrix to understand how the features vary together, calculating eigenvectors and eigenvalues to identify the directions of the highest variance, and then projecting the data onto these new dimensions.
Examples & Analogies
Imagine trying to remember a story with numerous characters and events. PCA is like summarizing that story into its core parts — the main events and characters that drive the narrative. By focusing on these key aspects, you get the essential tale without losing clarity, just as PCA captures the most informative parts of high-dimensional data while reducing complexity.
t-SNE (t-Distributed Stochastic Neighbor Embedding)
Chapter 7 of 9
🔒 Unlock Audio Chapter
Sign up and enroll to access the full audio experience
Chapter Content
• Non-linear technique for visualization.
• Preserves local structure — good for cluster visualizations in 2D or 3D.
Key Concepts:
- Converts high-dimensional pairwise distances into probabilities.
- Minimizes the KL divergence between the high- and low-dimensional distributions.
Detailed Explanation
t-SNE is a nonlinear dimensionality reduction technique primarily used for visualizing high-dimensional data. It works by converting distances between data points into probabilities, preserving the local structure of the data. By minimizing the difference between the similarities in the high and low-dimensional representations (using Kullback–Leibler divergence), t-SNE effectively reveals clusters and allows for meaningful visualizations, particularly in 2D or 3D.
Examples & Analogies
Think of t-SNE like organizing your friends into a 3D bubble chart based on who is closest to whom in social interactions. The closer the bubbles, the stronger their connections, helping you visualize social dynamics better than if you simply tried to list everyone in a flat chart.
UMAP (Uniform Manifold Approximation and Projection)
Chapter 8 of 9
🔒 Unlock Audio Chapter
Sign up and enroll to access the full audio experience
Chapter Content
• Preserves both local and global structures.
• Faster and more scalable than t-SNE.
Detailed Explanation
UMAP is another powerful dimensionality reduction technique that aims to preserve both the local and global structures of the data while being faster and more scalable than t-SNE. It constructs a topological representation of the high-dimensional data and optimizes the representation in a lower-dimensional space, making it efficient and effective for visualizing complex datasets with meaningful interpretations.
Examples & Analogies
Imagine planning a road trip. UMAP is like having a map that shows both major highways (global structure) and scenic routes (local structure), giving you options that highlight the best travel experience, rather than pointlessly wandering through random side streets.
Applications of Clustering & Dimensionality Reduction
Chapter 9 of 9
🔒 Unlock Audio Chapter
Sign up and enroll to access the full audio experience
Chapter Content
| Application Area | Use Case |
|---|---|
| Marketing | Customer segmentation |
| Image Processing | Image compression, object recognition |
| Biology | Gene expression analysis, species classification |
| Recommender Systems | User-item clustering |
| Anomaly Detection | Fraud detection, fault diagnosis |
| Natural Language Processing | Topic modeling, document clustering |
Detailed Explanation
Clustering and dimensionality reduction have diverse applications across various fields. In marketing, clustering can analyze customer segments for targeted advertising. In image processing, these techniques help compress images and identify objects within them. In biology, they can assist in classifying species based on genetic information. Recommender systems utilize clustering to group similar users and items, while anomaly detection finds fraud patterns by clustering normal and abnormal behaviors. Finally, in NLP, topic modeling organizes documents semantically, leveraging clustering efficiently.
Examples & Analogies
Think of clustering and dimensionality reduction like a team of specialists in a hospital. Each specialist (application area) focuses on their unique department (use case), whether it's patients with similar symptoms (customer segmentation), analyzing blood test results (gene classification), or understanding medical histories (anomaly detection). Through their collaborative efforts, they enhance overall patient care just as these techniques improve data-driven decisions.
Key Concepts
-
Unsupervised Learning: A machine learning approach where models learn from unlabeled data.
-
Clustering: The process of grouping data points into clusters based on similarities.
-
K-Means: A popular clustering algorithm that partitions data into K clusters.
-
Hierarchical Clustering: A clustering approach that creates a hierarchy of clusters.
-
DBSCAN: A density-based clustering method that finds arbitrary-shaped clusters.
-
Dimensionality Reduction: Techniques to reduce the number of features while retaining essential information.
-
PCA: A linear method for transforming data to capture maximum variance.
-
t-SNE: A non-linear visualization method for high-dimensional data.
-
UMAP: A scalable dimensionality reduction method that preserves both local and global structures.
-
Curse of Dimensionality: Challenges that arise as the number of features increases.
Examples & Applications
In marketing, clustering can be used to segment customers based on purchasing behavior.
In image processing, dimensionality reduction techniques like PCA can be applied to compress images while retaining quality.
DBSCAN can identify fraudulent transactions by grouping similar patterns and flagging outliers.
t-SNE can be used to visualize clusters in high-dimensional gene expression data.
Memory Aids
Interactive tools to help you remember key concepts
Rhymes
In groups we cluster, learn with glee, finding patterns helps us see.
Stories
Imagine a librarian who organizes thousands of books without labels, grouping them by content, revealing the library's knowledge through clustering.
Memory Tools
PCA: Peak, Capture, Analyze - Think of it as finding the peak in data variance.
Acronyms
D for Density in DBSCAN
Remember
clusters are found through density!
Flash Cards
Glossary
- Clustering
The task of dividing a dataset into groups such that data points within the same group are more similar to each other than those in different groups.
- KMeans Clustering
A centroid-based algorithm that partitions a dataset into K clusters, with each cluster represented by a centroid.
- Hierarchical Clustering
A method of clustering that builds a tree of clusters, either by merging individual clusters or splitting larger clusters.
- DBSCAN
A clustering algorithm that groups together points that are closely packed together while marking points in low-density regions as outliers.
- Dimensionality Reduction
The process of reducing the number of random variables or features under consideration in a dataset.
- Principal Component Analysis (PCA)
A linear dimensionality reduction technique that transforms data into a new coordinate system defined by the directions of maximum variance.
- tSNE
A non-linear dimensionality reduction technique primarily used for visualizing high-dimensional datasets in lower dimensions.
- UMAP
A manifold learning technique for dimensionality reduction that preserves more of the global data structure than t-SNE.
- Silhouette Score
A metric used to assess how well-separated the clusters are by measuring how similar a sample is to its own cluster compared to others.
- Curse of Dimensionality
A phenomenon where the feature space becomes sparse due to high dimensionality, leading to challenges in clustering, classification, or regression.
Reference links
Supplementary resources to enhance your learning experience.