
Interpretation of Seismograms
Enroll to start learning
You’ve not yet enrolled in this course. Please enroll for free to listen to audio lessons, classroom podcasts and take practice test.
Interactive Audio Lesson
Listen to a student-teacher conversation explaining the topic in a relatable way.
Wave Arrival Identification
🔒 Unlock Audio Lesson
Sign up and enroll to listen to this audio lesson

Today we are diving into how we interpret seismograms, starting with wave arrivals. Can anyone tell me the first wave that arrives during an earthquake?

Is it the P-wave?
Correct! The P-wave is the first to arrive. It's fast and has a low amplitude. Remember, 'P' for 'Primary'. Can anyone tell me what wave follows it?

The S-wave, which is slower and tends to have a higher amplitude.
Exactly! 'S' stands for 'Secondary'. And lastly, we have Surface waves. Who can tell me about those?

They are the slowest and the most damaging!
Right! They have a long duration and carry the most energy, causing significant damage. So, the order is P-wave, then S-wave, and finally Surface waves. Remember, you can think of it as PSS: Primary, Secondary, Surface.
Amplitude Analysis
🔒 Unlock Audio Lesson
Sign up and enroll to listen to this audio lesson

Now let's discuss amplitude analysis. Why is analyzing the amplitude of seismic waves important?

It helps us understand how much energy was released during an earthquake.
Exactly! We derive important metrics like Peak Ground Acceleration, or PGA, and Peak Ground Velocity, PGV. Can someone explain what PGA is?
It's the maximum acceleration recorded at the ground surface.
Good! And why do we care about PGV?
Because it tells us how fast the ground is shaking.
Exactly! PGV is crucial for assessing potential damage to structures. Always remember, 'More amplitude means more energy and potentially more damage!'
Time Windowing
🔒 Unlock Audio Lesson
Sign up and enroll to listen to this audio lesson
Finally, let's talk about time windowing. Why is it essential for evaluating structural response?
It allows us to look at specific intervals on the seismogram that show different effects on structures.
Exactly! This is crucial for conducting a time-history analysis. Can anyone explain what a time-history is?
It’s a plot of ground motion versus time, right?
Yes, perfect! This helps us see how structures might behave over time during seismic loads. Remember, pinpointing the right time window can significantly improve our analysis!
Introduction & Overview
Read summaries of the section's main ideas at different levels of detail.
Quick Overview
Standard
In this section, we delve into interpreting seismograms, focusing on how to identify different seismic wave arrivals, analyze their amplitudes to assess energy release, and evaluate time windows to understand structural responses during seismic events. These interpretations are crucial for effective earthquake engineering and public safety.
Detailed
Interpretation of Seismograms
The interpretation of seismograms is a critical process in earthquake engineering and seismology. In this section, we explore the following key areas:
Wave Arrival Identification
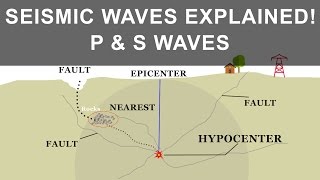
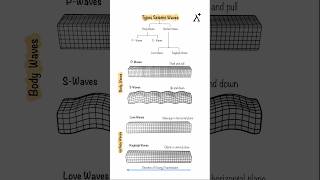
- P-wave: This is the first seismic wave to arrive at a recording station. It travels the fastest and has a low amplitude, indicating its preliminary nature.
- S-wave: Following the P-wave, the S-wave arrives with a slower speed and a higher amplitude. Its increased energy can lead to more substantial structural impacts.
- Surface Waves: The Love and Rayleigh waves are the slowest of the three, but they are capable of causing the most significant damage to structures due to their prolonged duration and high-energy release.
Understanding the sequence and characteristics of these waves is vital for determining the timing and potential impact of an earthquake.
Amplitude Analysis
Analyzing the amplitude of seismic waves provides insights into the energy released during an earthquake. Significant metrics derived from amplitude analysis include:
- Peak Ground Acceleration (PGA): Measures the maximum acceleration experienced at the ground surface, informing building design and safety measures.
- Peak Ground Velocity (PGV): Indicates the maximum velocity of ground shaking, playing a critical role in evaluating potential structural damage.
These measurements help engineers assess potential hazards and make informed decisions on infrastructure resilience.
Time Windowing
Time windows are specific intervals examined on a seismogram to evaluate a structure's response to seismic loading. This concept is essential for:
- Time-History Analysis: Critical for simulating the dynamic behavior of structures under seismic loads, allowing for improved design and safety assessments.
Overall, seismogram interpretation is fundamental in earthquake resilience planning, guiding insights into structural response analysis and hazard mitigation.
Youtube Videos


Audio Book
Dive deep into the subject with an immersive audiobook experience.
Wave Arrival Identification
Chapter 1 of 3
🔒 Unlock Audio Chapter
Sign up and enroll to access the full audio experience
Chapter Content
• P-wave: First arrival, fastest, low amplitude.
• S-wave: Arrives after P-wave, higher amplitude, slower.
• Surface waves (Love and Rayleigh): Slowest, cause most structural damage.
Detailed Explanation
This chunk explains the different types of seismic waves recorded in a seismogram. The P-wave is the first seismic wave to arrive because it travels the fastest and has a low amplitude, which means it can be less intense but is critical for identifying the beginning of an earthquake. After the P-wave, the S-wave arrives; it moves more slowly and is usually of higher amplitude, which means it is stronger and can cause more noticeable ground shaking. Finally, surface waves, which include Love and Rayleigh waves, are the last to arrive and are the largest in amplitude. They travel along the surface of the Earth and can cause significant structural damage, which is vital information for engineers assessing earthquake impacts on buildings.
Examples & Analogies
Imagine standing in a pool and watching as someone jumps in at the other end. The ripples (akin to P-waves) move quickly across the surface, and although they are the first disturbance, they don’t create waves that are too large. Then, when the diver (the S-wave) lands, the waves created are taller and stronger, shaking the water more. Finally, the bigger waves that form and roll along the sides of the pool (like surface waves) can cause splashes that are much more intense. Understanding these waves helps us prepare for the potential impacts of the diver’s jump on anyone standing by the edge.
Amplitude Analysis
Chapter 2 of 3
🔒 Unlock Audio Chapter
Sign up and enroll to access the full audio experience
Chapter Content
• Indicates energy release and potential damage.
• Peak ground acceleration (PGA) and peak ground velocity (PGV) are derived from this.
Detailed Explanation
Amplitude analysis involves measuring the height of the seismic waves recorded in a seismogram. The amplitude of these waves indicates how much energy was released during the earthquake and helps engineers and scientists determine the potential for damage. Two key values derived from this analysis are Peak Ground Acceleration (PGA), which measures the maximum acceleration of ground motion, and Peak Ground Velocity (PGV), which assesses the highest speed of ground motion observed. Both of these metrics are crucial for structural engineers to evaluate how buildings and other structures might respond to seismic events.
Examples & Analogies
Think of amplitude like a music concert's volume. If a band plays softly (low amplitude), you might hear it, but it won’t shake the walls of the venue. When they play a loud, powerful song (high amplitude), the sound vibrations not only reach your ears but can also rattle your seat and the building itself. Understanding the amplitude of seismic waves helps us predict how much an earthquake can 'rattle' a building.
Time Windowing
Chapter 3 of 3
🔒 Unlock Audio Chapter
Sign up and enroll to access the full audio experience
Chapter Content
• Focus on specific time intervals for evaluating structural response.
• Important for time-history analysis.
Detailed Explanation
Time windowing is a technique used in the interpretation of seismograms to concentrate on certain periods of time that are relevant for analyzing how structures react to earthquakes. By focusing on specific time intervals, engineers can look closely at how a structure responds to seismic forces, especially during critical moments when the force might be at its peak. This information is essential for time-history analysis, which helps predict how buildings will perform during actual seismic events and improve design strategies accordingly.
Examples & Analogies
Imagine watching a slow-motion replay of a sports game. You can focus on crucial moments, like a player scoring a goal, rather than trying to take in the entire game all at once. In a similar way, time windowing allows engineers to zoom in on the critical intervals of seismic activity that really impact how a building behaves during an earthquake.
Key Concepts
-
Wave Arrival Identification: Understanding the order and properties of P-waves, S-waves, and surface waves.
-
Amplitude Analysis: Analyzing wave amplitudes to derive PGA and PGV for assessing energy release and potential damage.
-
Time Windowing: Evaluating specific time intervals for structural response analysis through time-history.
Examples & Applications
During an earthquake, the P-wave arrives first, followed by the S-wave, and then the surface waves, which brings the most destruction.
If a recorded seismogram shows high PGV levels, engineers might need to design structures to withstand greater shaking.
Memory Aids
Interactive tools to help you remember key concepts
Rhymes
At the quake’s birth, P comes first, S follows quick, with strength that bursts; Surface last, so slow and strong, causing damage all along.
Stories
Imagine a race where the P-wave, like a speedy rabbit, dashes forward. The S-wave, a clever turtle, follows up, and lastly, the surface waves come to create chaos, reminding us that speed isn’t always strength.
Memory Tools
Remember 'PASS': P-wave, Arrival first; S-wave, Second; Surface waves, most destructive.
Acronyms
Remember the 'PSS'
for Primary (P-wave)
for Secondary (S-wave)
and Surface waves are the last.
Flash Cards
Glossary
- Pwave
The first seismic wave to arrive, characterized by its high speed and low amplitude.
- Swave
The second seismic wave to arrive, slower than P-waves and typically with higher amplitude.
- Surface Waves
Seismic waves that travel along the Earth's surface and cause the most damage during an earthquake.
- Peak Ground Acceleration (PGA)
The maximum acceleration recorded at a location during an earthquake, critical for assessing potential damage.
- Peak Ground Velocity (PGV)
The maximum velocity of ground shaking that contributes to the assessment of structural damage.
- Timewindowing
Focusing on specific time intervals of seismic data to evaluate structural responses during an earthquake.
Reference links
Supplementary resources to enhance your learning experience.