
Seismogram
Enroll to start learning
You’ve not yet enrolled in this course. Please enroll for free to listen to audio lessons, classroom podcasts and take practice test.
Interactive Audio Lesson
Listen to a student-teacher conversation explaining the topic in a relatable way.
Components of a Seismogram
🔒 Unlock Audio Lesson
Sign up and enroll to listen to this audio lesson

Today, we are going to explore the components of a seismogram. A seismogram records ground motions in three different axes: vertical, North-South, and East-West. Can anyone tell me what type of motion is captured in the vertical axis?

Is it the up-and-down motion during earthquakes?
Exactly! The vertical axis captures the up-and-down motion, typically affected by P-waves. Now, can anyone explain what the North-South and East-West components capture?

They capture lateral ground motion, right?
Yes! The North-South axis captures motion in that direction, and the East-West axis captures lateral motion in the opposite direction. Remember, each component offers distinct but complementary information about the ground motion. An easy way to recall this is to think of the acronym 'VNE' for Vertical, North, East!
Types of Seismograms
🔒 Unlock Audio Lesson
Sign up and enroll to listen to this audio lesson

Next, let’s discuss the types of seismograms. There are two main types: analog and digital. Who can explain how analog seismograms are recorded?

Analog seismograms used to be recorded on smoked or photographic paper, right?
Correct! And can anyone tell me a challenge associated with analog seismograms?

They’re hard to digitize and analyze with modern tools?
Exactly! On the other hand, we have digital seismograms that are recorded at high resolution and stored as time-series data, making them much easier to analyze. Remember: 'Analog is old, and Digital is bold!' as a mnemonic.
Interpretation of Seismograms
🔒 Unlock Audio Lesson
Sign up and enroll to listen to this audio lesson
Now, let’s look at how we interpret seismograms. What waves do we look for when interpreting seismograms?
The P-waves arrive first, followed by S-waves, and then the surface waves?
That's correct! The P-wave is the first and fastest, while surface waves are the slowest and most damaging. Now, why are amplitude and time window important in our analysis?
Amplitude indicates energy release and potential damage, right?
Exactly! And time windowing helps us focus on specific intervals which is particularly useful for evaluating structural responses. Remembering the acronym 'PAT' for Peak, Amplitude, Time can help you recall these critical aspects.
Introduction & Overview
Read summaries of the section's main ideas at different levels of detail.
Quick Overview
Standard
Seismograms are crucial for understanding earthquake dynamics as they record the movement of the earth's surface across three components: vertical and two horizontal axes. They provide valuable insight into seismic waves, helping engineers design earthquake-resistant structures.
Detailed
Detailed Summary of Seismograms
A seismogram is a graphical or digital representation showing the motion of the ground during an earthquake, created by an instrument known as a seismograph or seismometer. The primary purpose of a seismogram in earthquake engineering is to capture seismic waves generated by tectonic activity. This data allows engineers and seismologists to analyze ground motion, predict seismic impacts on structures, and ultimately, assist in the design of earthquake-resistant infrastructure.
Understanding seismograms is also critical for civil engineers as they inform site-specific seismic hazard analysis, structural response simulations, and the formulation of building codes. This section discusses the components of seismograms, their types, and interpretation, as well as applications in seismic hazard analysis and structural response evaluation.
Youtube Videos


Audio Book
Dive deep into the subject with an immersive audiobook experience.
What is a Seismogram?
Chapter 1 of 5
🔒 Unlock Audio Chapter
Sign up and enroll to access the full audio experience
Chapter Content
A seismogram is a graphical output or digital record that captures the motion of the ground during an earthquake. It is produced by an instrument called a seismograph or seismometer. The primary purpose of a seismogram in earthquake engineering is to record the seismic waves generated by tectonic activity, enabling engineers and seismologists to analyze the behavior of ground motion, predict seismic impacts on structures, and design earthquake-resistant infrastructure. Understanding seismograms is crucial for civil engineers, as these records directly inform site-specific seismic hazard analysis, structural response simulations, and building code formulations.
Detailed Explanation
A seismogram is essentially a visual tool that shows how the ground shakes during an earthquake. It’s created by a device called a seismograph that records movements in the earth. This data helps experts understand how earthquakes behave and how they might impact buildings and infrastructure. For engineers, seismograms provide vital information that helps them design structures that can withstand potential earthquakes by analyzing how ground movements could affect their designs.
Examples & Analogies
Think of a seismogram like a heart monitor for the Earth. Just as a heart monitor records the heart's rhythms and can predict possible health issues, a seismogram records the movements of the Earth and helps predict how an earthquake might impact buildings. If a heart shows irregularities, doctors can intervene; similarly, if engineers see troubling seismogram data, they can improve building designs to protect against damage.
Components of a Seismogram
Chapter 2 of 5
🔒 Unlock Audio Chapter
Sign up and enroll to access the full audio experience
Chapter Content
A seismogram records the movement of the earth’s surface in three components:
1. Vertical (Z-axis)
- Captures up-and-down motion.
- Usually affected by P-waves (primary waves).
2. Horizontal - North-South (N-S)
- Captures lateral ground motion in the N-S direction.
- Sensitive to both S-waves and surface waves.
3. Horizontal - East-West (E-W)
- Captures lateral ground motion in the E-W direction.
- Also responsive to S-waves and surface waves.
Each component provides independent but complementary information about the direction and magnitude of seismic motion.
Detailed Explanation
Seismograms capture seismic motions in three distinct ways: vertically, and horizontally along two axes—north-south and east-west. The vertical component records movements that go up and down and is primarily influenced by P-waves, which are the first waves to arrive during an earthquake. The horizontal components measure movements to the north-south and east-west; they are influenced by S-waves and surface waves, which can cause significant damage. Together, these three components paint a complete picture of how the ground is shaking in different directions and how strong those shakes are.
Examples & Analogies
Imagine holding a pen over a piece of paper and scribbling in different directions. Your up-and-down scribbles represent the vertical component, while your left-right and forward-backward scribbles represent the horizontal components. Just like those different motions give an overall view of your writing, the three components of a seismogram work together to illustrate how the ground moves during an earthquake.
Types of Seismograms
Chapter 3 of 5
🔒 Unlock Audio Chapter
Sign up and enroll to access the full audio experience
Chapter Content
There are two main types of seismograms:
1. Analog Seismograms
- Older instruments recorded motion on smoked paper or photographic paper.
- Difficult to digitize or analyze with modern tools.
2. Digital Seismograms
- Modern instruments digitize signals at high resolution.
- Stored as time-series data, enabling easier computation and interpretation.
Detailed Explanation
Seismograms can be divided into analog and digital types. Analog seismograms were created with older technology where the ground motion was physically recorded on paper, which makes it challenging to analyze using today’s advanced techniques. In contrast, digital seismograms are produced by modern instruments that convert ground motion into digital data. This allows the signals to be stored as time-series data, making them easier to process and analyze with computers. Digital seismograms have enhanced our ability to obtain detailed insights into seismic activities.
Examples & Analogies
Think of an analog seismogram like a vinyl record, where sound is physically etched into grooves. Playing it back can be difficult with modern technology. Digital seismograms are like an MP3 file where you can easily access and manipulate the music on your computer or phone. The digital format allows for clearer sound quality and easier editing, just like digital seismograms provide clearer insights and are easier to work with than their analog counterparts.
Interpretation of Seismograms
Chapter 4 of 5
🔒 Unlock Audio Chapter
Sign up and enroll to access the full audio experience
Chapter Content
Seismogram interpretation includes various aspects:
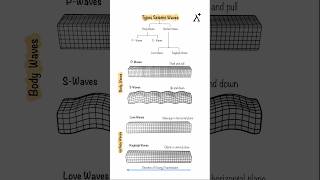
1. Wave Arrival Identification
- P-wave: First arrival, fastest, low amplitude.
- S-wave: Arrives after P-wave, higher amplitude, slower.
- Surface waves (Love and Rayleigh): Slowest, cause most structural damage.
2. Amplitude Analysis
- Indicates energy release and potential damage.
- Peak ground acceleration (PGA) and peak ground velocity (PGV) are derived from this.
3. Time Windowing
- Focus on specific time intervals for evaluating structural response.
- Important for time-history analysis.
Detailed Explanation
The interpretation of seismograms involves three key areas. First, identifying the different wave arrivals can help determine the nature of the earthquake. P-waves arrive first and are fast but have low energy, followed by S-waves, which are slower and have a higher amplitude, and then surface waves that do the most damage. Second, analyzing the amplitude of these waves gives insights into the earthquake's energy and potential structures' vulnerability. Lastly, time windowing focuses on certain time periods of the seismogram to evaluate how buildings might respond to the shaking during those intervals, which is crucial for understanding the earthquake's impact on structures.
Examples & Analogies
Imagine you're listening to a concert. The first notes that come from a quick-strumming guitar represent the P-waves; they are quick but soft. The drum beats that come afterward are like the S-waves; they hit harder and create more of a sensation. Finally, the bass drops, which is kind of like the surface waves—these have the most impact and can shake you the most. Understanding what each sound represents helps you appreciate the concert better, just as interpreting different wave arrivals and amplitudes helps engineers understand an earthquake's effects on buildings.
Seismogram Parameters
Chapter 5 of 5
🔒 Unlock Audio Chapter
Sign up and enroll to access the full audio experience
Chapter Content
Key parameters derived from seismograms include:
1. Peak Ground Acceleration (PGA)
- Maximum acceleration recorded during an earthquake.
- Used in design spectra and base shear calculations.
2. Peak Ground Velocity (PGV)
- Maximum ground velocity, critical in assessing potential structural damage.
3. Peak Ground Displacement (PGD)
- Important for evaluating permanent ground deformation effects.
Detailed Explanation
There are several key parameters we derive from seismograms that provide vital information about ground motion during an earthquake. Peak ground acceleration (PGA) measures the maximum acceleration during the shaking, which is essential for designing buildings that can resist that force. Peak ground velocity (PGV) indicates how fast the ground moves, which is also important for predicting if a structure will suffer damage. Lastly, peak ground displacement (PGD) measures the total movement of the ground at a point, which helps assess long-term effects of the shaking, like permanent shifts in the ground.
Examples & Analogies
Think of a roller coaster. The maximum height of the first drop is like PGA; you need to know that height to ensure the ride is safe. The speed at which the coaster travels through the track captures the dynamics of the ride, similar to PGV. Finally, if after a ride the coaster track is visibly displaced from its original position, that’s comparable to PGD—showing permanent impact from the ride. Just like these elements are crucial for roller coaster safety, the parameters from a seismogram help engineers safely design buildings to withstand earthquakes.
Key Concepts
-
Components of Seismograms: There are three components of a seismogram: vertical, North-South, and East-West, that provide independent data on ground motion.
-
Types of Seismograms: Seismograms can be analog or digital, each with distinct characteristics and analysis challenges.
-
Wave Arrival Identification: P-waves, S-waves, and surface waves have different arrival times and damage potential.
-
Amplitude Significance: The amplitude of waves indicates the energy released and potential for structural damage.
Examples & Applications
A seismogram showing a P-wave followed by an S-wave during an earthquake helps in identifying the earthquake's epicenter.
Analyzing a time-history record from a seismic event provides vital data for engineers in assessing structural integrity.
Memory Aids
Interactive tools to help you remember key concepts
Rhymes
Seismograms shake, up and down they quake, capturing motion for engineers to take.
Stories
Imagine a city during an earthquake. The buildings sway as P-waves arrive first, followed by the stronger S-waves. The engineers review seismograms to ensure that the structures remain safe. Every shake tells a story of the earth's rumble.
Memory Tools
Remember 'PSS for Waves': P-waves are Primary and fast, S-waves are Secondary and slow, and Surface waves are sinister and the most damaging.
Acronyms
VNE
Vertically
North-South
East-West - the axes of seismogram motion.
Flash Cards
Glossary
- Seismogram
A graphical output that captures ground motion during an earthquake.
- Seismograph
An instrument that measures and records ground motion.
- Pwave
The fastest seismic wave, arriving first and causing up-and-down motion.
- Swave
A seismic wave that arrives after the P-wave, causing lateral motion.
- Surface waves
The slowest seismic waves responsible for most structural damage.
- Amplitude
The height of a wave in a seismogram, indicating energy release.
Reference links
Supplementary resources to enhance your learning experience.