
Key Features - 8.3.2.2
Enroll to start learning
You’ve not yet enrolled in this course. Please enroll for free to listen to audio lessons, classroom podcasts and take practice test.
Interactive Audio Lesson
Listen to a student-teacher conversation explaining the topic in a relatable way.
Introduction to Profiling Tools
🔒 Unlock Audio Lesson
Sign up and enroll to listen to this audio lesson

Today, we'll explore some powerful profiling tools available for Linux kernel-space. Can anyone tell me what profiling in systems means?

Is it about monitoring system performance?
Exactly! Profiling helps us analyze system performance metrics such as CPU usage and memory consumption. Now, let's start with ftrace. What does anyone know about it?

I heard it's used to trace function calls in the kernel.
Right, ftrace tracks kernel function calls, which is crucial for identifying performance bottlenecks. A good way to remember it is: 'ftrace for function tracing!'

How do we use ftrace effectively?
To enable function tracing, we can use commands like 'echo function > /sys/kernel/debug/tracing/current_tracer'. This sets our tracer to function calls.

What outputs do we get?
You can view the output with 'cat /sys/kernel/debug/tracing/trace'. This shows you detailed trace logs!
In summary, ftrace is used to trace kernel functions to optimize performance. Remember, it's about tracking to improve!
Using perf Tool in Kernel Profiling
🔒 Unlock Audio Lesson
Sign up and enroll to listen to this audio lesson

Now, let's move on to another tool called perf. Who can explain its primary functions?
I think it collects CPU performance data?
That’s right! perf is excellent for collecting hardware-level performance metrics. It provides insights into CPU cycles, cache misses, and more. You could think of it as your performance doctor!
What kind of commands do we use with perf?
You can use 'perf stat ./my_program' to get basic statistics, or 'perf record ./my_program' for a detailed analysis.
Then, how do we review collected data?
You can generate a human-readable report with 'perf report'. It's crucial for understanding which parts of your program are underperforming.
To summarize, **perf** provides detailed performance data which helps pinpoint optimization opportunities. Remember: Performance is key!
Overview of SystemTap
🔒 Unlock Audio Lesson
Sign up and enroll to listen to this audio lesson
Let’s wrap up with SystemTap. Who can tell me what it does?
It helps trace kernel functions?
Absolutely! SystemTap dynamically traces functions and monitors kernel events, allowing real-time feedback without restarting your system.
How do we utilize SystemTap?
You run it with a command like 'stap -v my_trace_script.stp' where 'my_trace_script.stp' is your specific trace script.
What benefits does it bring?
SystemTap allows for in-depth kernel performance analysis, which is great for debugging and optimization efforts. Always crucial in maintaining system health!
In summary, SystemTap is your dynamic tracing buddy for kernel functions. Keep it handy!
Introduction & Overview
Read summaries of the section's main ideas at different levels of detail.
Quick Overview
Standard
The key features covered in this section include tools like ftrace and SystemTap that aid in evaluating kernel performance metrics. These profiling methods allow developers to track execution times, function calls, and other vital statistics, enabling the optimization of kernel performance.
Detailed
Key Features of Profiling Tools in Kernel-Space
This section delineates essential profiling tools used in Linux kernel-space to analyze system performance. Tools like ftrace, perf, and SystemTap are integral for developers looking to optimize kernel operations.
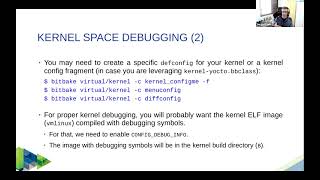
ftrace
- Purpose: ftrace is a tracing utility built into the Linux kernel, utilized to track function calls within the kernel. It helps developers get insights into the execution flow and identify potential bottlenecks.
- Usage: Enabling function tracing can be done through the command line, allowing real-time data capture.
perf
- Purpose: The perf tool is another robust resource for kernel profiling. It collects performance data including CPU cycles and other system event metrics.
- Basic Usage: Command-line instructions allow for the capturing of detailed profiling data and generating reports for analysis.
SystemTap
- Purpose: SystemTap facilitates dynamic tracing of kernel functions, offering a great deal of flexibility in monitoring kernel events.
- Key Features: It helps in evaluating performance across kernel functions and accessing details on kernel events efficiently.
The combination of these tools enables comprehensive monitoring and troubleshooting of kernel performance, significantly aiding developers in optimizing embedded Linux systems.
Youtube Videos

Key Concepts
-
ftrace: A kernel utility to trace function calls and analyze performance data.
-
perf: A profiling tool that collects and reports hardware performance metrics.
-
SystemTap: Enables dynamic tracing and monitoring of kernel functions and events.
Examples & Applications
Using ftrace to monitor function calls can reveal bottlenecks, ensuring better performance when tracing critical kernel functions.
Using 'perf record' followed by 'perf report' allows developers to identify which functions are consuming the most resources, leading to optimizations.
Implementing SystemTap scripts can help dynamically analyze kernel performance during specific events or system states.
Memory Aids
Interactive tools to help you remember key concepts
Rhymes
Ftrace to see which functions call, perf for the stats, measuring performance tall.
Stories
Imagine a detective, ftrace, who follows the actions of every kernel function, while perf is the analyst charting every heartbeat of the CPU.
Memory Tools
Remember: 'FPS' - F for ftrace, P for perf, S for SystemTap to monitor kernel metrics.
Acronyms
Think 'F.P.S' - 'Ftrace', 'Perf', 'SystemTap', for toolkits that analyze your code's cap!
Flash Cards
Glossary
- ftrace
A tracing utility in the Linux kernel used to track function calls and monitor performance.
- perf
A performance analysis tool for collecting hardware performance events and metrics.
- SystemTap
A tool that allows dynamic tracing of kernel functions and monitoring events for performance analysis.
Reference links
Supplementary resources to enhance your learning experience.