System Debugging in Linux
Enroll to start learning
You’ve not yet enrolled in this course. Please enroll for free to listen to audio lessons, classroom podcasts and take practice test.
Interactive Audio Lesson
Listen to a student-teacher conversation explaining the topic in a relatable way.
Introduction to Debugging User-Space Applications
🔒 Unlock Audio Lesson
Sign up and enroll to listen to this audio lesson

Today, we'll start with user-space applications. Can anyone tell me what GDB stands for?

I believe it stands for GNU Debugger.

That's correct! GDB is a powerful debugging tool. It helps you inspect and control the execution of a program. For example, it can help find segmentation faults. What's a segmentation fault?

It's an error that occurs when a program tries to access an area of memory that it's not allowed to.

Right! Remember the acronym 'DIVE' for using GDB: Debug, Inspect, Verify, Exit. Now, can anyone share how we would set a breakpoint in GDB?

We would use the 'break' command followed by the line number or function name, right?

Exactly! Let's recap. GDB allows us to debug by inspecting program execution in a controlled manner.
Memory Debugging with Valgrind
🔒 Unlock Audio Lesson
Sign up and enroll to listen to this audio lesson

Now let's shift gears to Valgrind. Who can explain what Valgrind does?

Valgrind helps detect memory leaks and memory corruption in applications.

Great! It provides a detailed log of memory usage. If you're debugging a program, how would you start it with Valgrind?

You can use the command `valgrind --leak-check=full ./my_program`.

Exactly! Remember, the key term 'MAL' can help you recall Memory Access Logs from Valgrind. What are some common issues Valgrind helps uncover?

It uncovers issues like invalid memory accesses and memory leaks.

Exactly! Valgrind is essential for any C or C++ programmer. Always remember to check your memory.
Tracing System Calls with Strace
🔒 Unlock Audio Lesson
Sign up and enroll to listen to this audio lesson

Next up, we have Strace. Who can explain what Strace is used for?

Strace is used for tracing system calls made by programs.

Exactly! It helps us understand the interactions between user-space applications and the kernel. Can anyone tell me how to use Strace?

You can run it with the command `strace ./my_program`.

Correct! It's crucial for debugging. Remember the acronym 'TRAINS' – Trace, Review, Analyze, Interact, Notify, System. Who can summarize when we might want to use Strace?

When we're unsure what system calls a program is making, or if it’s failing to access a resource.

Well done! Strace gives us great insight into those underlying operations.
Debugging Kernel-Space Code
🔒 Unlock Audio Lesson
Sign up and enroll to listen to this audio lesson

Let's pivot to kernel-space debugging. Who can tell me about the dmesg command?

Dmesg displays kernel log messages which helps us understand system events.

Correct! It's an easy way to check for hardware or driver issues. Can someone explain how we can enable kernel messages?

Using dmesg, you can just type `dmesg | tail` to see the most recent messages.

Fantastic! Remember the phrase 'KLM' for Kernel Log Monitor. Now, what about printk? How does it fit in?

Printk is used within kernel code to log messages, similar to print statements in user-space.

Exactly! It helps developers output debug messages. Always ensure your printk messages are informative!
Introduction & Overview
Read summaries of the section's main ideas at different levels of detail.
Quick Overview
Standard
In this section, we explore various debugging techniques and tools available in Linux, focusing on both user-space applications and kernel space code. Key tools discussed include GDB, Valgrind, Strace, dmesg, and KGDB, among others, which facilitate efficient troubleshooting and debugging.
Detailed
System Debugging in Linux
Debugging is a crucial process in software development that involves identifying and correcting errors within both user-space applications and kernel components of Linux. This section outlines essential tools and methods used for debugging, particularly in Linux-based environments, which are vital for maintaining system stability and performance.
Key Points Covered:
- Debugging User-Space Applications: We examine tools like GDB (GNU Debugger) for interactive debugging, Valgrind for memory management issues, and Strace for tracing system calls. Each tool has unique features that aid in diagnosing problems effectively.
- Debugging Kernel-Space Code: We explore commands and tools such as dmesg for checking kernel logs, printk for printing debug messages to logs, and debuggers like KGDB and KDB that allow in-depth analysis of kernel behavior.
Overall, mastering these debugging tools enhances our capability to troubleshoot and optimize Linux systems effectively.
Youtube Videos


Audio Book
Dive deep into the subject with an immersive audiobook experience.
Introduction to System Debugging
Chapter 1 of 9
🔒 Unlock Audio Chapter
Sign up and enroll to access the full audio experience
Chapter Content
System debugging involves identifying and fixing issues in both kernel and user-space components of the system. Linux provides a wide range of tools and techniques to troubleshoot problems, ranging from simple logs to advanced kernel debugging methods.
Detailed Explanation
System debugging is the process of finding and resolving issues in both the kernel (the core of the operating system) and the applications that run on top of it (user-space). The Linux operating system offers a variety of tools to help developers diagnose and fix problems. These can include basic logging tools, which provide simple error messages, as well as advanced tools that can delve deep into the kernel code, making it possible to troubleshoot complex system problems.
Examples & Analogies
Imagine you're a detective trying to solve a mystery. At first, you might start with simple clues like fingerprints (logs), which help you form theories about what happened. If those theories don't pan out, you might need to investigate deeper with more sophisticated methods, such as forensic analysis (advanced debugging tools) that help you uncover hidden evidence.
Debugging User-Space Applications
Chapter 2 of 9
🔒 Unlock Audio Chapter
Sign up and enroll to access the full audio experience
Chapter Content
User-space debugging involves various tools designed to diagnose issues in applications running outside the kernel. Tools like GDB, Valgrind, and Strace are commonly used for this purpose.
Detailed Explanation
Debugging user-space applications means fixing problems that occur in regular programs that users run, as opposed to the core of the operating system. GDB (GNU Debugger) is one of the most powerful tools for this, allowing programmers to pause program execution, examine variables, and step through code to understand how it operates. Valgrind checks for memory-related problems, such as leaks, while Strace traces the system calls made by a program, helping developers see how their applications interact with the system.
Examples & Analogies
Think of debugging a user-space application like fixing a car. GDB is like a mechanic who can stop and inspect different parts of the engine while the car is running. Valgrind acts like a sensor that lets you know if there are leaks in the car’s fuel system. Strace serves as a fine-tuned dashboard that tells you what the car's systems are doing and when problems occur.
GDB (GNU Debugger)
Chapter 3 of 9
🔒 Unlock Audio Chapter
Sign up and enroll to access the full audio experience
Chapter Content
- GDB (GNU Debugger): GDB is a powerful debugger for Linux systems that allows you to inspect and control the execution of a program. It can help diagnose issues like segmentation faults, memory access errors, and logical bugs.
- Key Features:
- Set breakpoints to pause the execution at a specific line of code.
- Step through code line-by-line to inspect the flow.
- Examine and modify variables in memory during execution.
Detailed Explanation
GDB is a key tool that allows developers to closely inspect how their programs run. You can set breakpoints, which are markers that tell the program to stop running at a particular point, allowing you to check the values of variables and how your code is behaving at that moment. By stepping through the code line by line, you can see how the execution flows and identify where things might be going wrong.
Examples & Analogies
Imagine you are a director filming a movie. GDB is like a video playback tool that lets you pause the film at critical moments to check the actors’ performances (your variables). If a scene doesn’t work, you could rewind and run through it again, making sure everything flows as it should from one shot to the next.
Valgrind
Chapter 4 of 9
🔒 Unlock Audio Chapter
Sign up and enroll to access the full audio experience
Chapter Content
- Valgrind: Valgrind is a memory debugging tool for detecting memory leaks, memory corruption, and memory management errors in C/C++ applications.
- Key Features:
- Detects invalid memory access (e.g., accessing freed memory).
- Identifies memory leaks by tracking unfreed memory allocations.
- Provides a detailed log of memory usage to help pinpoint errors.
Detailed Explanation
Valgrind helps programmers identify issues related to memory in their applications. When a program runs, it uses memory to store data. Sometimes, a program can 'forget' to release memory it no longer needs, leading to memory leaks. Valgrind watches all memory allocations and deallocations, producing a report that highlights any leaks or incorrect access patterns.
Examples & Analogies
Think of Valgrind like a housekeeper who checks every room in your house (the program's memory). If you leave the lights on in an empty room (using memory and not releasing it), the housekeeper will point this out to you, allowing you to tidy up that area and ensure your house runs efficiently.
Strace
Chapter 5 of 9
🔒 Unlock Audio Chapter
Sign up and enroll to access the full audio experience
Chapter Content
- Strace: Strace is used to trace system calls made by a user-space process, providing insights into the interactions between the process and the kernel.
- Key Features:
- Trace system calls such as file operations (open, read, write), network interactions, process creation, and more.
- Helps identify which system resources are being accessed and how.
Detailed Explanation
Strace allows you to watch what a specific application does behind the scenes. When an application runs, it often makes requests to the operating system for resources (like opening files or accessing the internet). Strace shows you all these requests, which can help identify where things might be going wrong.
Examples & Analogies
Consider strace like an observer at a restaurant kitchen. You can see how many ingredients the chef asks for (system calls), how they request them, and whether there's a mix-up in orders, giving you insight into how smoothly the meal (program) is prepared.
Core Dumps
Chapter 6 of 9
🔒 Unlock Audio Chapter
Sign up and enroll to access the full audio experience
Chapter Content
- Core Dumps: A core dump is a file that captures the memory of a process at the time of a crash. Analyzing core dumps can help diagnose issues in applications that unexpectedly terminate.
-
Basic Usage:
Enable core dumps with:
ulimit -c unlimited # Allow core dumps
Once the program crashes, a core dump file will be generated (e.g., core).
Analyze the core dump with GDB:
gdb ./my_program core
(gdb) backtrace # Get the stack trace
Detailed Explanation
When a program crashes unexpectedly, the system can create a core dump, which is essentially a snapshot of the program's memory at the time of the crash. Developers can use this data to investigate why the crash occurred by loading the core dump into GDB and examining the state of the program just before it failed.
Examples & Analogies
Think of a core dump like a forensic report left behind at the scene of an accident. It contains crucial details that can help investigators (developers) understand what went wrong and prevent future occurrences, giving them a complete view of events leading up to the crash.
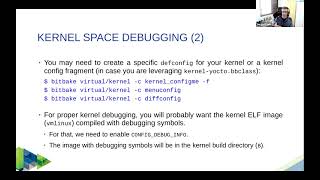
Debugging Kernel-Space Code
Chapter 7 of 9
🔒 Unlock Audio Chapter
Sign up and enroll to access the full audio experience
Chapter Content
8.2.2 Debugging Kernel-Space Code - This involves diagnosing issues within the Linux kernel itself, which is crucial for understanding hardware interactions and low-level system functionalities.
Detailed Explanation
Debugging kernel-space code involves fixing issues in the core of the operating system that manages hardware and system interactions. It's more complex than user-space debugging because a mistake can crash the entire system. Key tools include dmesg for viewing kernel messages, printk for logging debug messages, and KGDB for in-depth debugging sessions within the kernel.
Examples & Analogies
Consider this like working on an airplane's engine instead of a car engine. The stakes are higher, and there are more complex interactions between the components. Debugging here requires specialized tools and careful handling, since any mistakes could lead to a complete system failure.
dmesg and printk for Kernel Debugging
Chapter 8 of 9
🔒 Unlock Audio Chapter
Sign up and enroll to access the full audio experience
Chapter Content
- dmesg (Diagnostic Messages): The dmesg command displays kernel log messages, which provide information about system events, hardware interactions, driver messages, and errors.
- Key Features:
- View real-time kernel logs, especially useful for debugging hardware or driver issues.
- Inspect the output from device drivers, kernel modules, and system processes.
- Kernel Debugging with printk:
- The printk function is the kernel's equivalent of printf. It outputs messages to the kernel log (dmesg).
Detailed Explanation
The dmesg command allows you to view real-time logs generated by the kernel, making it easier to spot hardware issues or driver errors. Similarly, printk lets developers write messages to these logs from within the kernel code itself, helping to track down bugs during development by providing a way to see what's happening at any given time.
Examples & Analogies
Imagine you're running a factory. dmesg is like the factory floor's bulletin board where all workers can post updates on equipment status or errors. Meanwhile, printk is like a supervisor who can leave notes on that board, providing specific alerts whenever an issue is found during production.
KGDB and KDB for Kernel Debugging
Chapter 9 of 9
🔒 Unlock Audio Chapter
Sign up and enroll to access the full audio experience
Chapter Content
- KGDB (Kernel GNU Debugger): KGDB is a debugger for the Linux kernel. It allows you to debug kernel code on a live system, either via a serial connection or over a network.
- KDB (Kernel Debugger): KDB is a basic kernel debugger that can be used in environments where KGDB might not be available or suitable. It allows debugging via the console.
Detailed Explanation
KGDB allows developers to perform interactive debugging on a running kernel, enabling them to set breakpoints and inspect memory directly. KDB provides a more straightforward interface for kernel debugging, often used in situations where direct access to the kernel environment is necessary, and more advanced setups like KGDB are unavailable.
Examples & Analogies
Think of KGDB as a specialized diagnostic tool in a medical setting that allows doctors to perform complex tests and get real-time feedback on a patient's health (kernel). KDB is like a basic stethoscope, useful for checking the essentials when more advanced tools might not be accessible or necessary.
Key Concepts
-
Debugging: The process of identifying and fixing issues in software.
-
User-Space vs. Kernel-Space: User-space is where applications run, while kernel-space is reserved for the core of the operating system.
-
GDB: A debugger for stepping through code and inspecting the state of programs.
-
Valgrind: A tool that helps find memory-related problems in applications.
-
Strace: A utility for tracing all system calls made by a process.
-
dmesg: A command for outputting kernel log messages.
-
printk: Kernel function for outputting log messages during execution.
Examples & Applications
Using GDB's run command to execute your program and check for segmentation faults.
Running valgrind --leak-check=full ./my_program to find memory leaks and management errors.
Applying Strace with strace ./my_program to see each system call made during the program execution.
Using dmesg | tail to read the latest kernel message logs after a hardware driver issue.
Memory Aids
Interactive tools to help you remember key concepts
Rhymes
GDB's the key to debugging spree, / Memory leaks Valgrind can foresee.
Stories
Imagine GDB as a detective, tracing the clues in a program's execution, while Valgrind is the safety officer, checking for leaks as if guarding the heavy machinery from spilling.
Memory Tools
DIVE for using GDB - Debug, Inspect, Verify, Exit.
Acronyms
TRAINS for Strace - Trace, Review, Analyze, Interact, Notify, System.
Flash Cards
Glossary
- GDB
GNU Debugger, a tool for controlling the execution of programs and inspecting their state.
- Valgrind
A tool that detects memory leaks and memory corruption issues in programs.
- Strace
A diagnostic tool that monitors system calls made by a process.
- Core Dump
A file that captures the memory of a process at the time of a crash.
- dmesg
A command that displays messages from the kernel log.
- printk
A function for logging messages in the Linux kernel.
- KGDB
Kernel GNU Debugger, used for debugging kernel code.
- KDB
Basic Kernel Debugger for debugging from the console.
Reference links
Supplementary resources to enhance your learning experience.
