
Challenges in Organic Analysis
Enroll to start learning
You’ve not yet enrolled in this course. Please enroll for free to listen to audio lessons, classroom podcasts and take practice test.
Interactive Audio Lesson
Listen to a student-teacher conversation explaining the topic in a relatable way.
Understanding Peak Overlap and Calibration
🔒 Unlock Audio Lesson
Sign up and enroll to listen to this audio lesson

Let’s start by discussing what happens when peaks overlap in a chromatogram. Can anyone explain why peak overlap is problematic?

It can lead to inaccurate volume measurements or concentration calculations.
Exactly! To correct this, we might need to run the chromatogram again using different conditions. This is crucial because the area under the peak represents the analyte concentration. What do we call the process of determining these areas?

Peak integration.
Correct! And remember that calibration plays a huge role here. We usually calibrate based on concentration rather than mass. Why do you think that is?

Because mass losses can occur throughout the system, so focusing on concentration helps maintain consistency.
Good point! Throughout this process, understanding the relationships between concentration and the resulting chromatographic data is essential.
In summary, peak overlap can complicate analyses, necessitating recalibration and integration techniques to maintain accuracy.
Analyzing Detection Sensitivity
🔒 Unlock Audio Lesson
Sign up and enroll to listen to this audio lesson

Next, let’s chat about detection sensitivity. What do you think are the factors affecting our ability to detect compounds in an analysis?

The concentration of the analytes and the efficiency of the detection system.
Correct! Now, in mass spectrometry, we can employ different modes like SCAN and SIM. Can someone explain their differences?
SCAN analyzes all fragments, while SIM focuses on specific ions to increase sensitivity.
Exactly! SCAN provides a broader picture, whereas SIM can heighten sensitivity for specific compounds. What is a drawback of SIM?
It might miss other relevant compounds since it only focuses on selected ions.
Right! This highlights the importance of pre-analysis planning, where we define what compounds we aim to analyze.
In summary, understanding detection methods and their implications helps ensure effective organic analysis.
Challenges in Organic Analysis Techniques
🔒 Unlock Audio Lesson
Sign up and enroll to listen to this audio lesson
Let’s summarize how different techniques in organic analysis can impact our results. What do we need to consider when choosing methods?
Factors like analyte stability and concentration limits are crucial!
Exactly! And sometimes, we have to use approaches like derivatization to improve analyte stability. Have you all heard about this technique?
Yes, it’s used to modify compounds to make them easier to analyze.
Spot on! Derivatization plays a key role in maximizing the efficiency of detection methods. What’s the main goal we should keep in mind during organic analysis?
To achieve both accurate qualitative and quantitative results.
Well said! It’s crucial to balance both aspects for effective analysis.
In summary, understanding the methods, influences, and improving techniques like derivatization ensures we obtain reliable results.
Introduction & Overview
Read summaries of the section's main ideas at different levels of detail.
Quick Overview
Standard
The section delves into the complexities of organic analysis, emphasizing issues such as peak overlapping, calibration discrepancies, and the importance of sensitivity in detection methods. It explores the techniques used to ensure accurate qualitative and quantitative results, including the use of calibration curves and selective ion monitoring.
Detailed
Challenges in Organic Analysis
The challenges in organic analysis are manifold, particularly in gas chromatography (GC) and mass spectrometry (MS). Key issues include the overlap of peaks in chromatograms, necessitating the need for careful recalibration and re-separation when overlaps occur. The area under a peak in chromatograms is crucial as it directly relates to the concentration of the analyte, and integration methods are employed to quantify this accurately. Calibration can be performed based on concentration instead of mass due to uncertainties in mass loss within the system, where the focus is on maintaining a consistent response concerning concentration.
Analysts must also contend with systematic losses during the injection process, which may lead to decreased detection sensitivity. Therefore, the method of selected ion monitoring (SIM) becomes practical, as it increases sensitivity while sacrificing comprehensive identification capabilities. This comes into play especially when analyzing complex mixtures where the concentrations of analytes may be very low. The interaction between different strategies, like SCAN and SIM, shapes the approach to organic analysis, guiding the analyst's objectives in identifying and quantifying target compounds.
Youtube Videos


Audio Book
Dive deep into the subject with an immersive audiobook experience.
Chromatograph Integration
Chapter 1 of 6
🔒 Unlock Audio Chapter
Sign up and enroll to access the full audio experience
Chapter Content
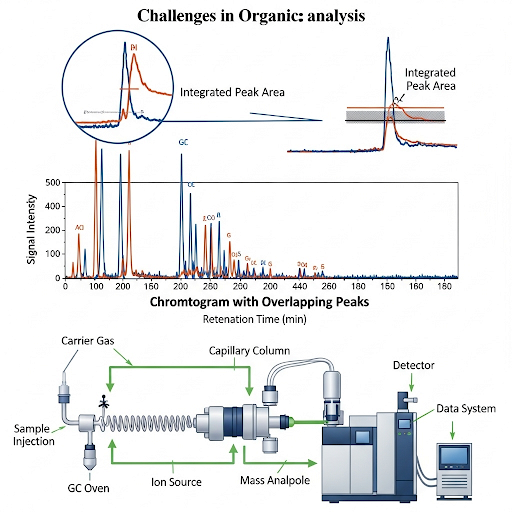
But if the peak is really overlapping then you have to go back do separation again you run the chromatography with different set of conditions. So, this is area under the peak the number now you are seeing is the peak that has been integrated, you see how it has been integrated there and they have an integrated area. So, it is integrated from this point to this point and throughout and this is some arbitrary area units. So, I can get a report like this.
Detailed Explanation
In chromatographic analysis, peaks represent different compounds. If peaks overlap, it means you can't distinguish between the substances present. To handle this, analysts must separate the compounds using different conditions in chromatography. The area under each peak represents the quantity of the compound detected. By integrating the area, we obtain a numerical value, which helps quantify the concentration of the substance in the sample.
Examples & Analogies
Imagine a crowded market where everyone is standing closely together, making it hard to see who is who (overlapping peaks). To identify individuals clearly, you might ask them to stand in a line (using different chromatography conditions), allowing you to see each person's unique attributes (the integrated area under each peak).
Calibration Challenges
Chapter 2 of 6
🔒 Unlock Audio Chapter
Sign up and enroll to access the full audio experience
Chapter Content
Then I can go to each one of these compounds if I know which one they are, I will do a calibration and the calibration is done again in terms of say concentration that you are injecting into the GC. Calibration can be done in mass or concentration. But here we are doing concentration because you do not know what is happening to the mass in the system.
Detailed Explanation
Calibration is crucial in quantitative analysis, where you match the response (area under the peaks) to known concentrations. In this process, it is often more reliable to calibrate based on concentration rather than mass, especially when there is uncertainty about the mass lost during the analysis. By focusing on concentration, we can more easily predict how much of each compound is present in our samples.
Examples & Analogies
Think of calibration like baking a cake. If you measured ingredients by weight but your scale is broken (mass loss), it would be easier to measure by volume (concentration). You use the same volume for each ingredient to maintain consistency in your cake recipe.
Loss of Compounds in the System
Chapter 3 of 6
🔒 Unlock Audio Chapter
Sign up and enroll to access the full audio experience
Chapter Content
One of the things that happens in the system is that there is a lot of loss that can happen in the injection system. When the sample is getting vaporized and pushed into the column. It may not come out of the column sometimes, and it may get adsorbed onto the injection system. It may get lost in the detector, it may be for various reasons compounds may not come out fully.
Detailed Explanation
During organic analysis, not all compounds injected into the chromatograph make it to the detector. Losses can occur due to several factors: some compounds may adsorb onto the injection apparatus, while others may not vaporize properly. These losses can lead to inaccurate quantification, where the reported concentration does not reflect the actual amount in the sample.
Examples & Analogies
Imagine you're trying to pour water from a pitcher into a glass, but some water spills over the sides and gets absorbed by the sponge nearby (loss during injection). What you have left in the glass doesn’t represent the total amount you started with.
Calibration Curves and Intercepts
Chapter 4 of 6
🔒 Unlock Audio Chapter
Sign up and enroll to access the full audio experience
Chapter Content
Sometimes you can choose without an intercept and all that is depending on how your calibration looks. You can do that but you have to be very careful. If the intercept is very large in this case, this slope is 655238 and intercept is 241455. It means if you run a blank and you have no compound it should give you that area.
Detailed Explanation
In calibration curves used for quantifying organic compounds, the slope represents the relationship between the concentration and the response (peak area). An intercept value can complicate the analysis; if it's too large, it might indicate that random noise is affecting your measurements. Analysts often choose to disregard the intercept if it's unreliable to ensure their results are based on a clean linear response.
Examples & Analogies
Think of a calibration curve like a race track. The slope is the steepness of the track that determines your speed, while the intercept is like an obstacle at the start. If the obstacle (intercept) is too big, it can mislead your starting speed measurements (results), so it's better to race without that obstacle in the way.
SIM vs SCAN Modes in Mass Spectrometry
Chapter 5 of 6
🔒 Unlock Audio Chapter
Sign up and enroll to access the full audio experience
Chapter Content
SCAN is what we just explained. If I want to scan the entire range of mass by charge by looking at whatever is there in the system... But what is the side effect? It increases sensitivity, which means I am able to detect lower concentrations.
Detailed Explanation
In mass spectrometry, SCAN mode allows the detection of a wide range of ions but can result in lower sensitivity for individual compounds. Alternatively, in Selected Ion Monitoring (SIM), we focus on specific ions of interest, improving the detection of compounds present at low concentrations. This means that for a more accurate quantification of certain compounds, SIM is often the preferred method despite its limitations in identifying unknown substances.
Examples & Analogies
Imagine using a spotlight (SCAN) to illuminate a dark room, allowing you to see everything around you, but the light is weak. In contrast, a laser pointer (SIM) beams directly onto a specific item, making it bright and clear, but it doesn't show the entire room.
Complications in Organic Analysis
Chapter 6 of 6
🔒 Unlock Audio Chapter
Sign up and enroll to access the full audio experience
Chapter Content
There are other complications in doing organic analysis, especially if you are doing things like organic acids and other things, which you need further processing. In order to do this. There is something called derivatization, which will increase the stability of the compound during the analysis.
Detailed Explanation
Certain organic compounds can be unstable during analysis, especially under the heat or exposure conditions required in chromatographic methods. Derivatization is a chemical procedure that alters the compound structure to enhance its stability and detectability. This step is essential in ensuring accurate and reliable analysis outcomes.
Examples & Analogies
Think of derivatization like putting a delicate flower in a protective case before displaying it. By protecting the flower (compound) during the exposure (analysis), it helps maintain its integrity and presentation in front of an audience (the analytical results).
Key Concepts
-
Peak Integration: The process of quantifying the area under a chromatographic peak to determine analyte concentration.
-
Detection Sensitivity: The ability of an analytical method to identify low concentrations of analytes.
-
Calibration Curve: A graph used to determine the concentration of an unknown by comparing it to a series of standards.
-
Selected Ion Monitoring (SIM): Technique used to enhance sensitivity by analyzing specific ions rather than all fragments.
-
Derivatization: A method for modifying analytes to enhance stability and detectability in analysis.
Examples & Applications
In gas chromatography, overlapping peaks can occur when two substances have close retention times. For example, if benzene and toluene are analyzed together, their peaks may overlap, necessitating re-analysis.
Using SIM can enable the detection of pesticides in low concentrations within a complex environmental sample, helping identify contamination levels more accurately.
Memory Aids
Interactive tools to help you remember key concepts
Rhymes
When peaks overlap, it's a detection trap; recalibrate fast, avoid analysis past!
Stories
Imagine a crowded café where voices overlap; you strain to hear one friend’s story. Similarly, in chromatography, overlapping peaks make it hard to identify compounds; you need to pick the right settings, just as you might move closer to your friend.
Memory Tools
Remember 'PICS': Peaks Integration Calibration Sensitivity Derivatization - key elements for successful analysis.
Acronyms
SIM
Selected Ion Monitoring - To Get Specific Ions
Monitor!
Flash Cards
Glossary
- Peak Overlap
The phenomenon where two or more chromatographic peaks coincide, complicating the identification and quantification of substances.
- Calibration
The process of adjusting and validating equipment settings to ensure accurate measured values against known standards.
- SIM (Selected Ion Monitoring)
A mass spectrometry technique that focuses on specific fragments to enhance detection sensitivity.
- SCAN
A mass spectrometry mode where a wide range of masses is monitored, allowing for comprehensive analysis.
- Derivatization
A chemical process that modifies a compound to enhance its properties, making it more suitable for analysis.
Reference links
Supplementary resources to enhance your learning experience.