
Quantitative and Qualitative Analysis
Enroll to start learning
You’ve not yet enrolled in this course. Please enroll for free to listen to audio lessons, classroom podcasts and take practice test.
Interactive Audio Lesson
Listen to a student-teacher conversation explaining the topic in a relatable way.
Understanding Peak Integration
🔒 Unlock Audio Lesson
Sign up and enroll to listen to this audio lesson

Today, we will talk about peak integration in chromatography. Can anyone tell me what peak integration is?

Is it about calculating the area under a peak?
Exactly! The area under the peak relates to the concentration of the compound in the sample. We integrate these areas to quantify how much of a substance is present. Remember, a larger area indicates a higher concentration.

And how do we ensure the measurements are accurate?
Great question, Student_2! This is where calibration comes into play. Can anyone explain why we use concentration for calibration?

It's because mass can vary within the system?
Correct! By calibrating based on concentration, we succinctly determine our substance's presence without worrying about the losses in the system.

So, we focus on area responses instead of masses?
Yes, that's right! Keep that in mind as we move forward.
In summary, peak integration quantifies substances based on the area under the peak in the chromatogram.
Calibration in Analysis
🔒 Unlock Audio Lesson
Sign up and enroll to listen to this audio lesson

Next, let's discuss calibration. Why is consistent calibration important?
To ensure that our results are accurate and reliable?
Exactly! Every calibration should yield a linear response. This implies that for a specific concentration, we obtain a corresponding peak area.
What if the response isn't linear?
Good point! If the response is nonlinear, it can affect the reliability of our measurements. We often ignore the intercept if it's not relevant, focusing only on the linear part.
That makes sense. Can we talk about the differences between SCAN and SIM modes?
Absolutely! SCAN collects data across the entire range, but that may reduce sensitivity. Who can tell me how SIM operates?
It focuses on specific ions to increase sensitivity.
Correct! SIM allows us to get improved detection limits by only analyzing selected ions.
In summary, reliable calibration and understanding SCAN and SIM modes play critical roles in accurate quantitative and qualitative analysis.
Challenges in Detection Limits
🔒 Unlock Audio Lesson
Sign up and enroll to listen to this audio lesson
Now, let's tackle detection limits. Why is knowing an instrument's minimum detection limit (MDL) important?
To understand the sensitivity? If it's too high, we might miss compounds.
Exactly! With SCAN mode, if the compound concentrations are too low, you might not see any peaks. In cases where you do see peaks, how can we guarantee they are not noise?
By using SIM for those specific compounds?
Precisely! SIM allows us to focus our attention on specific analytes we are interested in, improving our chances of detection.
What happens if we have unknown samples?
Great query! In unknown samples, we initially use SCAN to identify potential peaks and then switch to SIM for precise quantification after confirming retention times.
In summary, understanding detection limits and the utility of SCAN vs. SIM is crucial to successful analysis.
Application of Techniques
🔒 Unlock Audio Lesson
Sign up and enroll to listen to this audio lesson
Finally, let’s apply what we've learned. If we were analyzing for specific pharmaceuticals in water, what would our initial steps be?
We would likely determine the compounds to focus on and set up the system for SCAN first.
Exactly! After identifying potential compounds through SCAN, how do we refine our analysis?
By switching to SIM for those specific compounds, allowing us to quantify them efficiently.
Well put, Student_1! Remember, clear objectives guide your setup processes during analysis.
How do we confirm our findings for unknown compounds?
We would create a calibration curve based on known concentrations and advocate for spiking methods if needed.
In summary, applying these analytical techniques effectively requires careful planning and an understanding of the tools at our disposal.
Introduction & Overview
Read summaries of the section's main ideas at different levels of detail.
Quick Overview
Standard
In this section, we delve into how quantitative and qualitative analyses are carried out in chromatography. It highlights key concepts such as integrating peak areas, understanding calibration methods, and the roles of detection limits and analysis modes in achieving reliable results.
Detailed
Quantitative and Qualitative Analysis
This section explores the essential tools and methods employed in quantitative and qualitative analysis within chromatographic systems. A crucial aspect discussed is the integration of peak areas during chromatographic analysis, which allows for the quantification of analyte concentrations based on the area under the peaks in a chromatogram.
Key Concepts:
- Peak Integration: The area under the chromatographic peaks correlates to the concentration of compounds; precise integration reflects accurate quantification.
- Calibration: Calibration is grounded in measuring concentration rather than mass, as losses in the system can affect mass but usually not concentration consistently. This allows for systematic error handling in analyses.
- Detection Limits: The minimum detection limit (MDL) is crucial in determining the sensitivity of a given analysis. Techniques like SCAN and SIM help in identifying whether the compound is detectible at low concentrations.
- SCAN vs. SIM: SCAN mode looks for all fragments but can reduce sensitivity, while Selected Ion Monitoring (SIM) focuses on specific ions, enhancing detection at trace levels but may compromise the identification of unknown compounds.
- Compound Identification: Identifying compounds accurately is essential for analyses, which hinges on understanding retention times and calibration methods.
Through understanding these processes, one can grasp the complexities of accurately performing quantitative and qualitative analyses in a laboratory setting.
Youtube Videos


Audio Book
Dive deep into the subject with an immersive audiobook experience.
Chromatography and Integration
Chapter 1 of 5
🔒 Unlock Audio Chapter
Sign up and enroll to access the full audio experience
Chapter Content
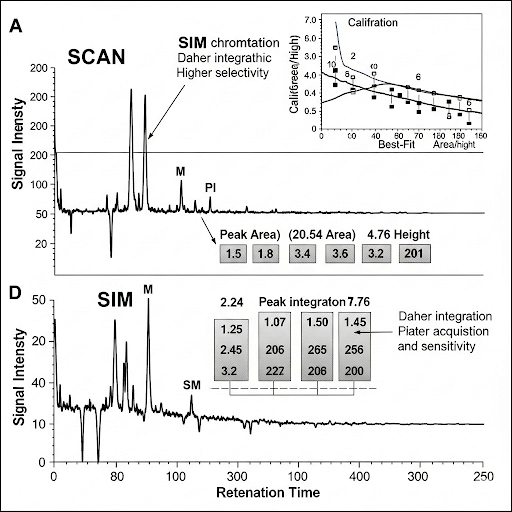
So, this is area under the peak the number now you are seeing is the peak that has been integrated, you see how it has been integrated there and they have an integrated area. So, it is integrated from this point to this point and throughout and this is some arbitrary area units.
Detailed Explanation
In chromatography, when we analyze samples, we often look at the peaks generated in the chromatogram. Each peak represents a specific compound, and the area under each peak correlates to the concentration of that compound in the sample. Integration is the mathematical process of calculating this area, helping us quantify how much of each compound is present. The area measurement is arbitrary and serves as a tool for comparison rather than a direct concentration value.
Examples & Analogies
Imagine you're at a concert, and each song played has a varying duration. The total length of each song can represent the amount of enjoyment or engagement you get from it. Similarly, the longer the peak in a chromatogram, the more of that specific compound is present in your sample.
Calibration Basics
Chapter 2 of 5
🔒 Unlock Audio Chapter
Sign up and enroll to access the full audio experience
Chapter Content
Then I can go to each one of these compounds if I know which one they are, I will do a calibration and the calibration is done again in terms of say concentration that you are injecting into the GC. Calibration can be done in mass or concentration. But here we are doing concentration because you do not know what is happening to the mass in the system.
Detailed Explanation
Calibration is a critical process in quantitative analysis. It involves preparing standards with known concentrations and running them through the chromatography system. This allows us to create a relationship between the area under the peaks and the actual concentration of compounds. Concentration is usually preferred over mass during calibration because it provides a more direct and consistent measurement relative to what’s being injected into the system.
Examples & Analogies
Think of calibration like adjusting a recipe based on tasting your dish. If you add too much salt, the recipe might be off, but by knowing how much salt you added each time, you can find the right balance for future dishes. Similarly, calibration helps ensure that the chromatography results are accurate.
Factors Affecting Measurement
Chapter 3 of 5
🔒 Unlock Audio Chapter
Sign up and enroll to access the full audio experience
Chapter Content
So, one of the things that happens in the system as you are seeing that there is a lot of loss that can happen in the injection system.
Detailed Explanation
During the chromatography process, particularly at the injection stage, some of the sample may be lost. This can happen due to various reasons, such as incomplete vaporization, adsorption onto the injection system, or even losses in the detector. It's essential to recognize these losses, but as long as the losses are consistent each time the calibration is performed, they will not significantly affect the quantification, as the relationship remains constant.
Examples & Analogies
Imagine pouring a drink into a glass but spilling a bit on the counter each time. While you're losing some liquid, if you consistently know how much you're pouring, you can still measure how much is left in the glass. In chromatography, understanding these losses helps maintain accuracy even if your results sometimes vary slightly.
Understanding Sensitivity and Detection Limits
Chapter 4 of 5
🔒 Unlock Audio Chapter
Sign up and enroll to access the full audio experience
Chapter Content
So, if I want to get above the detection limit of the instrument I must be able to have enough concentration here that goes to detector.
Detailed Explanation
Sensitivity is critical in analytical chemistry, as it determines the smallest amount of a substance that can be reliably detected by an instrument. Each instrument has a defined detection limit, and to successfully analyze a sample, the concentration of the compound must surpass this limit. If a compound’s concentration is too low, it may not produce a detectable signal, making it impossible to analyze successfully.
Examples & Analogies
Consider trying to hear someone whisper from across a room. If the noise level is too high, you won't be able to hear them no matter how hard you try. Similarly, in chemistry, if the concentration of a compound is too low compared to the noise or background signal, you won't be able to detect it.
Scan vs. Selected Ion Monitoring (SIM)
Chapter 5 of 5
🔒 Unlock Audio Chapter
Sign up and enroll to access the full audio experience
Chapter Content
So, in order to prevent this, what this does is it reduces sensitivities i.e., SCAN which means that to have my minimum detection limit high, I need higher concentration detected.
Detailed Explanation
When using the SCAN mode in techniques such as GC-MS, the instrument is set to detect all ions across a broad spectrum. While this provides comprehensive information about the sample, it can lower sensitivity because the time spent analyzing each ion is limited. On the other hand, Selected Ion Monitoring (SIM) focuses only on specific ions, increasing sensitivity and the ability to detect lower concentrations of those specific compounds, making the analysis more manageable when targeting known substances.
Examples & Analogies
Imagine you're in a library looking for one book among thousands. If you search through all the books randomly (SCAN mode), it'll take longer and be less efficient. If you're given a list of specific titles to find, you can focus on those books and locate them much quicker and easier (SIM mode).
Key Concepts
-
Peak Integration: The area under the chromatographic peaks correlates to the concentration of compounds; precise integration reflects accurate quantification.
-
Calibration: Calibration is grounded in measuring concentration rather than mass, as losses in the system can affect mass but usually not concentration consistently. This allows for systematic error handling in analyses.
-
Detection Limits: The minimum detection limit (MDL) is crucial in determining the sensitivity of a given analysis. Techniques like SCAN and SIM help in identifying whether the compound is detectible at low concentrations.
-
SCAN vs. SIM: SCAN mode looks for all fragments but can reduce sensitivity, while Selected Ion Monitoring (SIM) focuses on specific ions, enhancing detection at trace levels but may compromise the identification of unknown compounds.
-
Compound Identification: Identifying compounds accurately is essential for analyses, which hinges on understanding retention times and calibration methods.
-
-
Through understanding these processes, one can grasp the complexities of accurately performing quantitative and qualitative analyses in a laboratory setting.
Examples & Applications
In a chromatogram with two overlapping peaks, integration helps determine the area attributable to each compound.
Using SIM can reveal peaks in a chromatogram that SCAN may have missed due to low concentration.
Memory Aids
Interactive tools to help you remember key concepts
Rhymes
To find out how much is in your test, integrate those peaks for the best.
Stories
Imagine a detective solving a mystery, where each peak in a chromatogram reveals clues about a different suspect's concentration level.
Memory Tools
Remember C-P-M, Concentration is the key, Peak area for quantitative glee, Maximum detection limit is made to see!
Acronyms
MDL (Minimum Detection Limit)
Measure
Detect
Limit.
Flash Cards
Glossary
- Peak Integration
The process of calculating areas under chromatographic peaks, which correlate with analyte concentration.
- Calibration
The process of establishing a relationship between known concentrations and their corresponding peak areas.
- Minimum Detection Limit (MDL)
The lowest concentration of an analyte that can be reliably measured by an analytical procedure.
- SCAN Mode
A chromatographic detection mode that scans across the entire mass range but may lower sensitivity.
- Selected Ion Monitoring (SIM)
A focused detection mode that targets specific ions to increase overall sensitivity of the analysis.
- Retention Time
The time it takes for a compound to travel through the chromatography system to the detector.
Reference links
Supplementary resources to enhance your learning experience.