
Chromatography and Calibration
Enroll to start learning
You’ve not yet enrolled in this course. Please enroll for free to listen to audio lessons, classroom podcasts and take practice test.
Interactive Audio Lesson
Listen to a student-teacher conversation explaining the topic in a relatable way.
Basics of Chromatography
🔒 Unlock Audio Lesson
Sign up and enroll to listen to this audio lesson

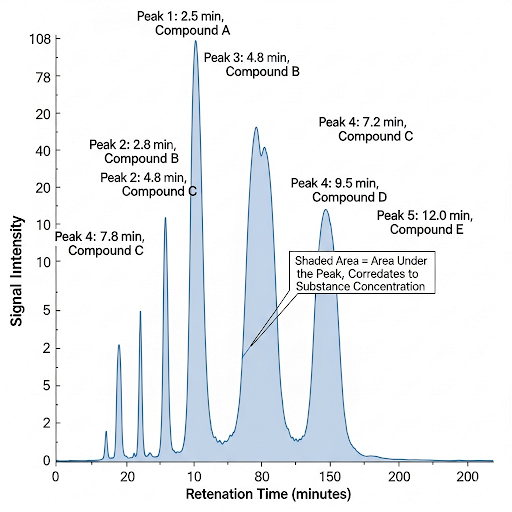
Today we'll delve into chromatography—it's crucial for separating mixtures into individual components. The peaks in a chromatogram represent compounds, and we utilize the area under these peaks to quantify them.

How do we actually measure the area under the peak?
Great question! We integrate the area from a defined start point to an endpoint along the peak, and this gives us an arbitrary area unit corresponding to the compound's concentration.

So, if peaks overlap, do we lose accuracy?
Exactly! Significant overlaps require us to adjust our methods or run the chromatography under different conditions. Keeping track of peaks is essential for reliable data.

I remember PEAK as in 'Precise Evaluation of Area under the Curve' to keep this in mind!
That's a fantastic mnemonic, Student_3! Remembering PEAK helps emphasize how vital assessing these areas accurately is.
Calibration Techniques
🔒 Unlock Audio Lesson
Sign up and enroll to listen to this audio lesson

Calibration plays a major role in our chromatography analysis. We often calibrate based on concentration rather than mass due to potential losses during analysis.

Wait, why do we focus on concentration?
Because we may not know how much mass is lost during the injection phase. Focusing on concentration allows us a consistent base for comparison across runs.
So, does that mean if the same concentration yields varying area responses, something's wrong?
Indeed! If your calibration shows non-linear responses, you may need to revisit your calibration procedures to ensure reliable results. Remember, consistent calibrations lead to more accurate quantifications.
Could we use a mnemonic here? Like 'CALIBRATION for Consistent Area and Linear Integration before Testing Responses'?
I love it! That kind of creative thinking helps reinforce the key principles—great job!
Detection Limits in Analysis
🔒 Unlock Audio Lesson
Sign up and enroll to listen to this audio lesson
Now, let's cover detection limits. If a sample is below these limits, we can't identify it accurately. This leads us to two chief modes of GC-MS: SCAN and SIM.
What's the difference between those modes?
SCAN analyzes all fragments across a wide mass range, while SIM focuses only on specific fragments, enhancing sensitivity to detect smaller concentrations.
Doesn’t focusing on one compound risk missing something important?
Certainly! Using SCAN initially to identify potential compounds and then switching to SIM helps balance this risk.
I see—start broadly, then narrow down. How about we remember SCAN as 'Search, Collect, Analyze, Navigate'?
Perfect! Remember that strategy, and you'll have a strong grasp of our approach.
Introduction & Overview
Read summaries of the section's main ideas at different levels of detail.
Quick Overview
Standard
The section explains the role of chromatography in separating compounds within a mixture, details how calibration ensures accurate measurements, and highlights the significance of concentration over mass in calibrating responses during analysis.
Detailed
Detailed Summary
This section on Chromatography and Calibration provides a comprehensive overview of the chromatography process, emphasizing the significance of calibrating measurements in gas chromatography (GC). The teacher explains that overlapping peaks in chromatograms may necessitate adjustments in conditions or re-calibration to ensure reliable analysis.
Key Points:
- Area under the Peak: The chromatogram's peaks represent the concentration of substances by integrating the area under the peak. This area correlates with the quantity of the compound being analyzed.
- Calibration Emphasis: Calibration in chromatography is often based on concentration rather than mass because losses can occur during the injection and vaporization phases besides measurement. Regular checks during calibration ensure linearity and consistency in responses.
- Detection Limits: The discussion covers detection limits and suggests that if a compound is below these limits, it might be deemed unidentifiable. The two operating modes of GC-MS, SCAN and SIM, are explained:
- SCAN mode enables a broad analysis of all fragments but may reduce sensitivity and detection due to time constraints.
- SIM is focused on specific fragments, allowing for higher sensitivity and lower detection likelihood.
- The section concludes that calibration is critical for accurately identifying compounds and determining trace concentrations, ultimately demonstrating the complexity involved in quantitative and qualitative chromatography analysis.
Youtube Videos


Audio Book
Dive deep into the subject with an immersive audiobook experience.
Understanding Peak Integration
Chapter 1 of 5
🔒 Unlock Audio Chapter
Sign up and enroll to access the full audio experience
Chapter Content
But if the peak is really overlapping then they will you have to go back do separation again you run the chromatography with different set of conditions. So, this is area under the peak the number now you are seeing is the peak that has been integrated, you see how it has been integrated there and they have an integrated area. So, it is integrated from this point to this point and throughout and this is some arbitrary area units.
Detailed Explanation
When analyzing data from chromatography, a peak represents a specific compound. If two peaks overlap, it means we cannot distinguish between the two compounds accurately. To resolve this, we may need to change the conditions of the chromatography process. The area underneath a peak, obtained by integration, is a quantitative measure of the amount of the substance within that peak. The integration gives us a numeric value that is expressed in arbitrary area units, which helps us get insights into the concentration of the compound.
Examples & Analogies
Imagine you're baking cookies, and you have both chocolate chip and peanut butter cookie dough, but they’re mixed together. If you try to taste each cookie, it’s difficult to determine where one flavor ends and the other begins. You might need to separate the dough into two distinct batches (changing the chromatography conditions) to get distinct flavors (individual peaks) for accurate tasting (analysis). The sweetness you can taste (integrated area) represents how sweet the cookies are.
The Importance of Calibration
Chapter 2 of 5
🔒 Unlock Audio Chapter
Sign up and enroll to access the full audio experience
Chapter Content
Then I can go to each one of these compounds if I know which one they are, I will do a calibration and the calibration is done again in terms of say concentration that you are injecting into the GC. Calibration can be done in mass or concentration. But here we are doing concentration because you do not know what is happening to the mass in the system.
Detailed Explanation
Calibration in chromatography is key for accurate analysis. It involves preparing a standard solution of known concentration and measuring its response. We typically calibrate based on concentration since many variables affect the mass during the measurement process, making direct measurements of mass unreliable. Calibration ensures that we can relate the area measured under a peak to the original concentration of the compound we analyzed.
Examples & Analogies
Think of calibration like adjusting the scales at a bakery. If the scales are off, you might end up with too much flour (mass) even though you measured the same amount (concentration). By calibrating the scales with known weights, you ensure that you’re accurately measuring the ingredients needed for your recipes.
Challenges in Detection and Sensitivity
Chapter 3 of 5
🔒 Unlock Audio Chapter
Sign up and enroll to access the full audio experience
Chapter Content
So one of the things that happens in the system as you are seeing that there is a lot of loss that can happen in the injection system. When the sample’s getting vaporized and gets pushed into the column. It may not come out of the column sometimes, and it may get adsorbed onto the injection system.
Detailed Explanation
In chromatography, not all of the injected sample reaches the detector. Loss can occur during vaporization, adsorption on parts of the system, or even when some compounds do not exit the column. This loss can affect the accuracy of our results, making it crucial to understand these limitations when interpreting data. We often accept that some loss will occur and focus instead on the relationship between injected concentration and the measured response.
Examples & Analogies
Imagine trying to fill a water balloon. Some water splashes out during transfer or gets absorbed by the cloth you're using to hold the balloon. Even though you started with a specific amount of water (concentration), not all of it makes it into the balloon (measured response), but you still measure how full the balloon is based on what you managed to get inside.
Using Selected Ion Monitoring (SIM)
Chapter 4 of 5
🔒 Unlock Audio Chapter
Sign up and enroll to access the full audio experience
Chapter Content
So, in order to prevent this, what this does is it reduces sensitivities i.e., SCAN which means that to have my minimum detection limit high, I need higher concentration detected. So, if there are really large number of units of the detection, the detector has an MDL.
Detailed Explanation
Selected Ion Monitoring (SIM) is a technique used to enhance the sensitivity of mass spectrometry. Instead of scanning all the ions present, SIM allows us to focus on specific ions of interest. This increases the chances of detecting trace amounts of compounds since the detector spends more time analyzing each selected ion. While this method increases sensitivity, it can reduce the breadth of detected information.
Examples & Analogies
Consider SIM like using a spotlight in a dark room to find your favorite book on a shelf. Instead of looking at the entire shelf (SCAN), you focus the light on a specific area where you know your book is. This lets you find your book quickly even if it’s surrounded by other items, improving your chances of spotting it in the dark.
Preparation for Specific Analyses
Chapter 5 of 5
🔒 Unlock Audio Chapter
Sign up and enroll to access the full audio experience
Chapter Content
So now, one of the things that we have seen is that the goals in terms of sensitivity. So, we know that the GCMS can be run in two modes of operation, one is called as a SCAN. SCAN is what we just explained. If I want to scan the entire range of mass by charge by looking at whatever is there in the system.
Detailed Explanation
With the goals of enhancing sensitivity in analyses, it’s critical to understand the operation modes of a GC-MS system. SCAN mode gives us an overview of all available compounds but may miss low concentrations due to limited detection capabilities. For targeted analyses, however, we often employ SIM to focus on specific compounds that matter for our study.
Examples & Analogies
This is like trying to find the right apples in an orchard. If you walk through the whole orchard (SCAN), you might miss some apples hidden behind trees or in leaves. However, if you have a list of the exact apple types you want (specific searches), you can go straight to the trees that are known to have those kinds, increasing your chances of success.
Key Concepts
-
Area under the peak: Represents the quantity of a substance in chromatography.
-
Calibration: Essential for accurate quantification and measurement of compounds.
-
Detection Limit: The minimum concentration that can be reliably identified in an analysis.
Examples & Applications
Example 1: In a chromatogram, the area under a peak of 100 arbitrary units correlates directly with a concentration of 1 mg/L of compound A.
Example 2: If a sample peak area consistently returns 150 units at a specific concentration, this indicates successful calibration of the GC system.
Memory Aids
Interactive tools to help you remember key concepts
Rhymes
In chromatography, we seek to see, the area 'neath the peak, that's key for me!
Stories
Imagine a detective separating suspects in a lineup; chromatography does similar work with mixtures to find individual components.
Memory Tools
Remember PEAK: P = Precise, E = Evaluation, A = Area, K = Knowledge in chromatography!
Acronyms
CALIBRATION - Consistent Area Linear Integration Before Results Are Tabled.
Flash Cards
Glossary
- Chromatography
A technique for separating components in a mixture based on their different affinities to a stationary and mobile phase.
- Calibration
The process of adjusting the accuracy of a measuring device or system, based upon comparison with a standard.
- Peak Integration
A method of quantifying the area under a chromatographic peak to determine the concentration of a component.
- Detection Limit
The lowest quantity of a substance that can be reliably detected but not necessarily quantified.
- SCANNING
A mode in gas chromatography where all fragments across a mass range are detected.
- SIM
Selected Ion Monitoring, a mode focusing on specific fragments for increased sensitivity.
Reference links
Supplementary resources to enhance your learning experience.