
Log-time curve fitting method
Enroll to start learning
You’ve not yet enrolled in this course. Please enroll for free to listen to audio lessons, classroom podcasts and take practice test.
Interactive Audio Lesson
Listen to a student-teacher conversation explaining the topic in a relatable way.
Introduction to Plotting Data
🔒 Unlock Audio Lesson
Sign up and enroll to listen to this audio lesson

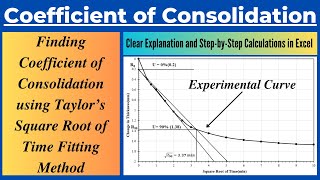
To start with the log-time curve fitting method, it's crucial to understand how we plot our initial data. We take dial readings and plot them against the square root of time, which facilitates our analysis.

Why do we use the square root of time instead of just time?
Great question! Using the square root of time gives us a linear relationship in many cases, simplifying our calculations and interpretations of the curve.

So, if we're plotting two variables, will they always form a curve?
Not always! It depends on the relationship between those two variables. But for consolidation, we typically see a curve.

How do we know where to draw the tangent?
We focus on the initial part of the plot, where the curve behaves more consistently. This is where we can accurately establish the tangent.

Can this tangent help us make predictions?
Absolutely! The tangent helps us understand the initial rate of consolidation and provides insight into the behavior of the soil over time.
In summary, plotting correctly is foundational. Understanding this process allows for more accurate predictions in soil behavior.
Drawing the Tangent and Using PR
🔒 Unlock Audio Lesson
Sign up and enroll to listen to this audio lesson

Let’s move on to drawing line PR, where we relate the lengths of OQ and OR. Can anyone tell me the ratio we use here?
Is it 1.15 times OQ?
Right! OR is 1.15 times OQ, which helps us establish the point where PR intersects the curve, marking point S.
Why is this point S important?
Point S provides a crucial intersection that represents a specific time in the consolidation process, which can be vital for further calculations.
How can we apply this in real-world scenarios?
This method allows engineers to predict time needed for field deposits, ensuring safer designs in construction.
So the lines on our plots do not only represent data points but also represent predictive behavior?
Exactly! And this visualization empowers us to grasp important underlying principles of soil consolidation.
In summary, understanding the tangent and its interplay with the curve helps us make informed decisions regarding soil stability and safety.
Introduction & Overview
Read summaries of the section's main ideas at different levels of detail.
Quick Overview
Standard
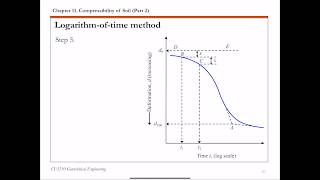
This section discusses the log-time curve fitting method, including the steps to plot data points and derive important features of the curve which help in predicting consolidation times effectively.
Detailed
Log-time Curve Fitting Method
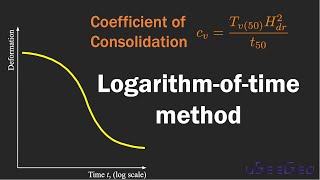
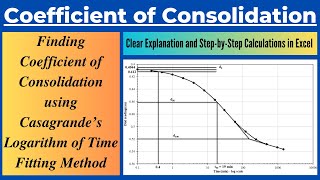
The log-time curve fitting method is essential in predicting the time required for a specific degree of consolidation in soil samples. This method involves plotting dial readings against the logarithm of time to create a visual representation of the consolidation process. The steps involve: plotting the readings against the square root of time, drawing a tangent to the curve, and using specific points to establish predictive lines. The critical aspect of this methodology is understanding how the rate of consolidation relates to the time and drainage path length, thereby allowing for accurate predictions for field deposits. Applying this method can provide valuable insights into soil mechanics and help civil engineers design safer infrastructures.
Youtube Videos


Audio Book
Dive deep into the subject with an immersive audiobook experience.
Plot the Dial Reading vs. Square Root of Time
Chapter 1 of 4
🔒 Unlock Audio Chapter
Sign up and enroll to access the full audio experience
Chapter Content
- Plot the dial reading and square root of time i.e T for a pressure increment as shown in figure.
Detailed Explanation
This step involves creating a graph where the x-axis represents the time (T) plotted as its square root and the y-axis represents the dial reading. This visual representation helps to analyze the relationship between time and the dial readings during pressure increments in a consolidation test.
Examples & Analogies
Imagine you are measuring how long it takes for a sponge to absorb water. If you plot how much water the sponge has absorbed against the time (with time being represented in a special way, like using the square root), you'll be able to see patterns that help you understand how quickly the sponge works over time.
Draw a Tangent to the Initial Portion
Chapter 2 of 4
🔒 Unlock Audio Chapter
Sign up and enroll to access the full audio experience
Chapter Content
- Draw a tangent PQ to the initial portion of the plot as shown in fig.
Detailed Explanation
In this step, you draw a straight line (the tangent) that touches the curve at its starting point without cutting through it. This tangent line represents the rate at which the dial reading is increasing initially. By analyzing this slope, you can infer how quickly the consolidation process begins.
Examples & Analogies
Think of riding a bike. When you start pedaling, there is an initial acceleration before you reach a steady speed. The tangent helps us understand that initial acceleration, similar to how quick you go right after you start pedaling.
Drawing Line PR
Chapter 3 of 4
🔒 Unlock Audio Chapter
Sign up and enroll to access the full audio experience
Chapter Content
- Draw a line PR such that OR=1.15OQ.
Detailed Explanation
Here, you will create another line, PR, where the length is proportionally set to be 1.15 times the length of a segment OQ on the graph. This step identifies a specific relationship between these segments and will assist in locating the next critical point on the curve, which is important for calculating consolidation.
Examples & Analogies
Imagine measuring the height of a door. If you already know one part is, say, 1 meter tall, determining another part to be 1.15 meters tall means adjusting your measurement to ensure it's correctly scaled up. This similarity helps you see how proportions are used in our graph to find more information.
Identifying Point S
Chapter 4 of 4
🔒 Unlock Audio Chapter
Sign up and enroll to access the full audio experience
Chapter Content
- The intersection of the line PR with the second portion of the curve i.e point S is marked.
Detailed Explanation
This final step involves identifying the point where the line PR intersects with the secondary section of the plotted curve. This point, labeled as S, is significant in the analysis as it represents a critical state of consolidation that is used for further calculations.
Examples & Analogies
Think of setting a goal in a marathon. The intersection point S is like reaching a certain milestone in the race, confirming that you've reached a significant point in your journey towards completion. Identifying it helps you understand your progress and plan further actions.
Key Concepts
-
Plotting Dial Readings: It involves plotting pressure gauge reading against the square root of time for analysis.
-
Tangent and Point S: The tangent helps measure the initial rate of consolidation, and Point S marks the intersection significant for predictions.
-
Time Rate of Consolidation: It relates to the drainage path and is crucial for determining how soil will behave under load.
Examples & Applications
Example 1: If the dial reading indicates a reading of 5 at a square root time of 2, then plotting that point on the graph would represent a significant step in analyzing the soil's consolidation behavior.
Example 2: After plotting data for multiple increments, drawing the tangent at Point P allows predictions about the consolidation rate which can be essential for construction projects.
Memory Aids
Interactive tools to help you remember key concepts
Rhymes
To predict how soils behave, use log-time as your wave. Plot the curve, draw it straight, predict the time, don't hesitate!
Stories
Imagine you're a soil technician assessing a construction site. You draw a graph of time versus pressure readings to ensure the site is stable. When you draw the tangent and find Point S, you can confidently tell the construction manager how long it will take before it’s safe to build!
Memory Tools
To remember the order: Plot -> Tangent -> PR -> Predict. Use 'P-T-P-P' where P stands for Plot and Predict, and T for Tangent.
Acronyms
For soil consolidation, use S.T.A.P
for Soil
for Time
for Analysis
for Prediction.
Flash Cards
Glossary
- Logtime curve fitting
A method used to analyze and model the time response of soil consolidation using the logarithm of time.
- Tangent
A straight line that touches a curve at a single point, used to approximate the behavior of the curve.
- Consolidation
The process where soil grains are pressed closer together, leading to a decrease in volume due to pressure.
- Point S
The specific point of intersection on the curve that signifies a particular consolidation time.
Reference links
Supplementary resources to enhance your learning experience.