
Drawing the Tangent
Enroll to start learning
You’ve not yet enrolled in this course. Please enroll for free to listen to audio lessons, classroom podcasts and take practice test.
Interactive Audio Lesson
Listen to a student-teacher conversation explaining the topic in a relatable way.
Introduction to Curve Fitting
🔒 Unlock Audio Lesson
Sign up and enroll to listen to this audio lesson

Today, we’re going to explore the methods of curve fitting related to consolidation pressure increments. To start, can anyone explain why curve fitting might be important in our analysis?

It helps us understand how quickly consolidation occurs over time!
Exactly! Understanding the rates helps engineers predict settling times. Now, how do we define our x-axis and y-axis for this plot?

The x-axis is the square root of time and the y-axis is the dial reading.
Correct! This relationship is crucial for determining the tangent. Let's move into drawing the tangent PQ on our curve.
Drawing the Tangent
🔒 Unlock Audio Lesson
Sign up and enroll to listen to this audio lesson

When we draw the tangent PQ, what are we trying to achieve?

To find the rate of change at that point on the curve?
Exactly! The tangent represents the instantaneous rate of consolidation. Now, once the tangent is drawn, we need to find PR. What do we do next?

We draw line PR so that OR equals 1.15 OQ.
Great! This allows us to map the consolidation degree more clearly on our graph.
Interpreting the Results
🔒 Unlock Audio Lesson
Sign up and enroll to listen to this audio lesson
After marking point S at the intersection of line PR with the second portion of the curve, what's the significance?
It shows us how far along the consolidation is at that specific time point.
Exactly! And this allows us to predict how long it will take for a given degree of consolidation based on drainage path length.
What if we had to do this for a field deposit instead of a lab sample?
Good question! The methods remain similar, but we must validate laboratory results against field measurements.
Conclusion and Recap
🔒 Unlock Audio Lesson
Sign up and enroll to listen to this audio lesson
To wrap up, can you summarize the steps we took in drawing the tangent and its implications?
We plotted the dial readings against the square root of time, drew the tangent PQ, then constructed PR while identifying point S.
Well said! These steps create a visual representation aiding in understanding consolidation dynamics.
And we learned how to predict future consolidation based on those findings.
Absolutely! You're all grasping these concepts quite well.
Introduction & Overview
Read summaries of the section's main ideas at different levels of detail.
Quick Overview
Standard
In this section, we explore the drawing of tangents to the initial portions of square-root and log-time curves related to pressure increment analysis. Key steps include plotting data points, drawing tangent lines, and understanding the implications of the time required for consolidation.
Detailed
Drawing the Tangent
In this section, we delve into the detailed method of curve fitting for consolidation analysis when pressure increments are applied. The process begins with plotting dial readings against the square root of time, representing the time-rate of consolidation. A crucial step involves drawing a tangent (PQ) to the initial portion of this plot, which helps in assessing the rate of consolidation in the early stages.
Additionally, we draw a line (PR) such that the length OR equals 1.15 times the length of OQ. The intersection of line PR with the second portion of the curve (point S) is marked, facilitating the analysis of consolidation at various stages of time.
Understanding the significance of these methods and their graphical representation is key to predicting the time required for a specified degree of consolidation based on the drainage path length, particularly using laboratory data applied to field conditions.
Youtube Videos


Audio Book
Dive deep into the subject with an immersive audiobook experience.
Plotting the Data
Chapter 1 of 4
🔒 Unlock Audio Chapter
Sign up and enroll to access the full audio experience
Chapter Content
- Plot the dial reading and square root of time i.e T for a pressure increment as shown in figure.
Detailed Explanation
In the first step, you need to create a graph that plots the dial readings against the square root of time. This involves taking measurements of pressure increments and recording how those pressures change over time. The square root of time is used in this context because it can help illustrate how the rate of consolidation varies over time.
Examples & Analogies
Think of this process like tracking your speed while driving. Just as you would log your speed at different times to understand how quickly you’re moving, here you're logging pressure readings at different intervals to understand how they change over time.
Drawing the Initial Tangent
Chapter 2 of 4
🔒 Unlock Audio Chapter
Sign up and enroll to access the full audio experience
Chapter Content
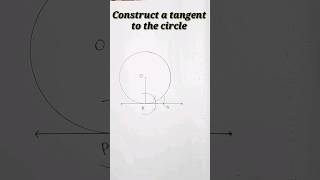
- Draw a tangent PQ to the initial portion of the plot as shown in fig.
Detailed Explanation
Next, you take the graph you created and draw a tangent line that touches the curve at the starting section, denoted as line PQ. This tangent line represents the initial behavior of the data, specifically how quickly the pressure readings change at the beginning of your observations.
Examples & Analogies
Imagine you are observing how a ball rolls down a hill; drawing the tangent is like marking the steepest part of the hill at the start where the ball speeds up the fastest.
Constructing the Reference Line
Chapter 3 of 4
🔒 Unlock Audio Chapter
Sign up and enroll to access the full audio experience
Chapter Content
- Draw a line PR such that OR=1.15OQ.
Detailed Explanation
In this step, you need to draw another line, PR, in such a way that point OR (where the line intersects the axis) is 1.15 times the distance of OQ (the tangent line). This step helps create a reference that connects your initial tangent with further data points on the graph, providing a scale for comparison.
Examples & Analogies
It's akin to measuring out a specific distance on a map. If you know one length, you can accurately mark another that is proportionally longer, which helps in making further calculations easier.
Identifying the Intersection Point
Chapter 4 of 4
🔒 Unlock Audio Chapter
Sign up and enroll to access the full audio experience
Chapter Content
- The intersection of the line PR with the second portion of the curve i.e point S is marked.
Detailed Explanation
Finally, the last step is to find where the line PR intersects with the second segment of the data curve. This intersection point, labeled as S, is crucial as it provides insights into how consolidation progresses once the initial phase has been accounted for in the analysis.
Examples & Analogies
Think of this as finding where a path you are walking meets another road. By knowing this point, you can see how your journey (data evolution) is progressing and what decision (analysis) to make next based on how far you have come.
Key Concepts
-
Drawing the Tangent: Key to analyzing rate of consolidation.
-
Pressure Increment: Importance in plotting dial readings over time.
-
Curve Intersection: Significance for predicting consolidation behavior.
Examples & Applications
In the laboratory, you measure the consolidation of a soil sample under pressure to predict how much it will settle in the field.
Creating a graph with dial readings clustered closely around the initial tangent slope helps visualize early consolidation rates.
Memory Aids
Interactive tools to help you remember key concepts
Rhymes
When you draw a line straight and true, the consolidation rate comes into view.
Stories
Imagine a farmer drawing straight lines on a growing field, plotting the time and pressure to understand how deep the roots grow each day.
Memory Tools
To remember the steps: Plot-Tangent-Draw Line-Intersect vowels (O-U), which corresponds to OR and OQ.
Acronyms
PTDI for Plot-Tangent-Draw Line-Intersect helps recall process steps.
Flash Cards
Glossary
- Tangent
A straight line that touches a curve at a point, representing the slope of the curve at that point.
- Consolidation
The process in which soils decrease in volume due to applied pressure, resulting in settlement.
- Drainage Path
The distance through which pore water needs to travel to reach the drainage boundary, affecting consolidation time.
Reference links
Supplementary resources to enhance your learning experience.