
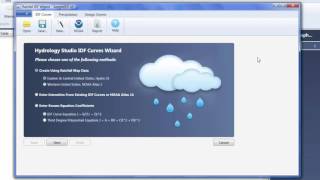
Development of IDF and DDF Curves
Enroll to start learning
You’ve not yet enrolled in this course. Please enroll for free to listen to audio lessons, classroom podcasts and take practice test.
Interactive Audio Lesson
Listen to a student-teacher conversation explaining the topic in a relatable way.
Data Requirements for IDF and DDF Development
🔒 Unlock Audio Lesson
Sign up and enroll to listen to this audio lesson

To develop accurate IDF and DDF curves, we need long-term rainfall records from reliable meteorological stations. Can anyone tell me what kind of rainfall data is essential?

We need hourly or sub-hourly rainfall data, right?
Exactly! This data is crucial for understanding short-duration rainfall events. What else do you think plays a role in this analysis?

How about annual maximum series or partial duration series?
That's spot on! Using these series helps in analyzing rainfall extremes. So remember, the key data requirements are long-term records, hourly data, and annual or partial duration series.
Frequency Analysis Methods
🔒 Unlock Audio Lesson
Sign up and enroll to listen to this audio lesson

Next, let's move on to frequency analysis methods. Who can name one of the distributions used for this purpose?

Isn't the Gumbel Distribution commonly used?
Absolutely! The Gumbel Distribution is a fundamental tool for analyzing extreme rainfall events. Can anyone think of another distribution?

How about the Log-Pearson Type III?
Good job! The Log-Pearson Type III is also widely used. These methods fit the rainfall data to derive values for different return periods, which helps in designing flood controls and drainage.
Importance of IDF and DDF Curves
🔒 Unlock Audio Lesson
Sign up and enroll to listen to this audio lesson
Now that we've covered the data and methods, why do you think IDF and DDF curves are important in hydrology?
They help us predict rainfall intensity and depth for planning drainage systems!
Exactly! They are vital for drainage systems, flood control, and urban designs. Can anyone share an example of their application?
Urban drainage management would be one!
Absolutely! Understanding these curves leads to better water resource management.
Introduction & Overview
Read summaries of the section's main ideas at different levels of detail.
Quick Overview
Standard
The section provides a comprehensive overview of the necessary data for developing IDF and DDF curves, such as long-term rainfall data, and reviews popular statistical methods for frequency analysis, including the Gumbel Distribution and Log-Pearson Type III. The section highlights how these curves are crucial for hydrological design and modeling.
Detailed
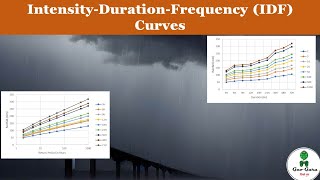
Development of IDF and DDF Curves
In hydrology, the Intensity-Duration-Frequency (IDF) and Depth-Duration-Frequency (DDF) curves are essential for understanding and predicting rainfall behaviors over different durations and return periods. This section discusses the development of these curves, starting with the necessary long-term rainfall data from reliable meteorological stations, including hourly or sub-hourly data for short durations.
The section outlines three key statistical methods for conducting frequency analysis:
1. Gumbel Distribution - primarily used for extreme value analysis.
2. Log-Pearson Type III - suitable for various types of data.
3. General Extreme Value (GEV) Distribution - another method used for fitting the rain data.
The outcome of these analyses aids in deriving rainfall values for various return periods, which is crucial for hydrological design applications such as drainage systems and flood control. By understanding the IDF and DDF curves, engineers and planners can make informed decisions that enhance water resource management and sustainability.
Youtube Videos


Audio Book
Dive deep into the subject with an immersive audiobook experience.
Data Requirements
Chapter 1 of 2
🔒 Unlock Audio Chapter
Sign up and enroll to access the full audio experience
Chapter Content
- Long-term rainfall records from reliable meteorological stations.
- Hourly or sub-hourly rainfall data for short durations (e.g., 5-min, 15-min).
- Annual maximum series or partial duration series are used.
Detailed Explanation
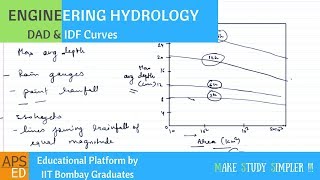
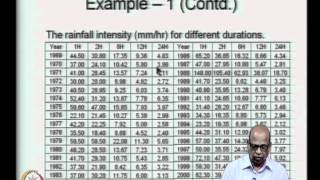
To develop Intensity-Duration-Frequency (IDF) and Depth-Duration-Frequency (DDF) curves, we need specific data. First, we require long-term rainfall records collected from dependable meteorological stations that have measured rainfall consistently over many years. This helps ensure that the data reflects various weather patterns and events.
Next, we need short-duration rainfall data, ideally hourly or even shorter time intervals such as 5-minute or 15-minute intervals. This granularity is important for capturing the intensity of rainfall during brief, intense events. Finally, we utilize two specific types of rainfall series: the annual maximum series, which records the highest rainfall amounts in each year, and the partial duration series, which captures significant rainfall events irrespective of the year. Together, these datasets form the foundation for accurately constructing IDF and DDF curves.
Examples & Analogies
Think of building a library of rainfall records as collecting stories from a neighborhood over the years. You want the most memorable stories that capture intense events (like a flood), which would be like our annual maximum series, as well as stories that include many interesting moments, even if they aren't the absolute highest (like the partial duration series). The goal is to have a complete picture of varying rainfall events, which will help us when we build drainage systems as if we were creating solutions inspired by those stories of weather events.
Frequency Analysis
Chapter 2 of 2
🔒 Unlock Audio Chapter
Sign up and enroll to access the full audio experience
Chapter Content
- Gumbel Distribution (most commonly used)
- Log-Pearson Type III
- General Extreme Value (GEV) Distribution
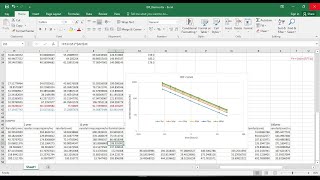
The data is statistically fitted to these distributions to derive rainfall values for different return periods.
Detailed Explanation
Once we have the required data, the next step is to conduct frequency analysis to understand how often certain levels of rainfall occur. This is typically done using statistical distributions. The three main distributions used in this context are the Gumbel Distribution, Log-Pearson Type III, and General Extreme Value (GEV) Distribution.
The Gumbel Distribution is particularly popular for modeling extreme values, such as heavy rainfall events. The Log-Pearson Type III distribution helps assess flood risks and is useful for estimating return periods based on longer records. The GEV Distribution also assists in this effort by providing a framework for analyzing extremes of different distributions. Each of these statistical distributions helps us fit our rainfall data so we can predict how frequently specific rainfall intensities will occur over designated return periods, which are essential for designing infrastructure.
Examples & Analogies
Imagine you're trying to understand how often it rains heavily in your town. You might take an average of past events to predict future rain. This is like how we analyze rainfall data using different statistical methods, similar to using various lenses to view the same painting to see different details. Each lens, or distribution, gives us insights into when we might expect another heavy rain, just as different perspectives can help us appreciate the overall picture.
Key Concepts
-
Data Requirements: Long-term rainfall records and sub-hourly data are vital for developing IDF and DDF curves.
-
Frequency Analysis: Methods such as Gumbel Distribution and Log-Pearson Type III are used for deriving rainfall values.
-
Application of IDF/DDF Curves: These curves are essential for designing drainage systems and flood management.
Examples & Applications
Using Gumbel Distribution to analyze extreme rainfall events for urban planning.
Applying DDF curves to model catchment runoff in hydrological studies.
Memory Aids
Interactive tools to help you remember key concepts
Rhymes
When it rains in short spans, IDF tells the plans.
Stories
Imagine a city preparing for rain. They gather data like warriors and analyze it like detectives; using Gumbel to predict floods and protect their homes.
Memory Tools
D-R-F for Data, Rainfall, Frequency - remember this trio for IDF and DDF.
Acronyms
IDF - Intensity, Duration, Frequency; DDF - Depth, Duration, Frequency.
Flash Cards
Glossary
- IntensityDurationFrequency (IDF)
A relationship that correlates rainfall intensity with storm duration for a given return period.
- DepthDurationFrequency (DDF)
A relationship that provides rainfall depth over time, which is useful for catchment modeling.
- Gumbel Distribution
A probability distribution used to model the distribution of extreme values.
- LogPearson Type III
A statistical distribution used for frequency analysis of hydrologic data.
- Return Period
The probability of an event occurring in any given year, often expressed in years.
Reference links
Supplementary resources to enhance your learning experience.