
Regionalization of IDF/DDF Relationships
Enroll to start learning
You’ve not yet enrolled in this course. Please enroll for free to listen to audio lessons, classroom podcasts and take practice test.
Interactive Audio Lesson
Listen to a student-teacher conversation explaining the topic in a relatable way.
Importance of Regionalization
🔒 Unlock Audio Lesson
Sign up and enroll to listen to this audio lesson

Today, we're diving into the regionalization of IDF/DDF relationships. Can anyone tell me why we must regionalize these relationships?

Is it because rainfall varies a lot in different places?
Exactly! Rainfall characteristics can be quite different across regions, so regionalizing IDF curves helps us create more accurate predictions for flood and drainage management. Let's remember this with the acronym 'H.R.D.': Homogeneous Rainfall Division. Student_2, do you know what the next step is?

We need to gather data from rain gauges, right?
Correct! Collecting long-term rainfall data from representative gauges is pivotal. This leads us to step 3, where we apply regional regression techniques to fit our IDF equation. Does anyone have any questions about this?

What if there's not enough data from a particular zone?
Good question! In such cases, we might have to use data from adjacent zones with similar characteristics to ensure our models are robust. Remember, having quality data is key!
So, recap — we slice the region into Homogeneous Rainfall zones, gather long-term data, and fit the IDF equation using regional regression techniques. Lastly, we create isopluvial maps to visualize our findings!
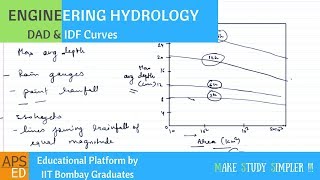
Creating Isopluvial Maps
🔒 Unlock Audio Lesson
Sign up and enroll to listen to this audio lesson

Now let's discuss isopluvial maps! Can anyone explain what they are and their importance?

Are they maps that show areas with equal rainfall? Like a rainfall contour map?
Exactly right! Isopluvial maps illustrate lines of equal rainfall depth or intensity. They help engineers estimate design storms in areas where no rainfall data is available. Student_1, can you think of a practical application of these maps?
For urban drainage systems, right? To ensure they can handle expected rainfall!
Yes! This is essential for effective urban flood management. We want to ensure that drainage systems can cope with maximum expected rainfalls, making isopluvial maps critical tools. Can anyone summarize what we just discussed?
We learned that isopluvial maps are used to show rainfall distribution across regions and that they're crucial for stormwater management planning.
Perfect summary! An excellent way to recap is: 'Maps Matter in Management.'
Introduction & Overview
Read summaries of the section's main ideas at different levels of detail.
Quick Overview
Standard
Understanding that rainfall characteristics can vary greatly among regions, this section outlines the steps necessary to regionalize IDF/DDF curves, including the need for dividing regions into homogeneous rainfall zones, analyzing long-term data, and employing regional regression techniques to develop accurate rainfall estimates for design purposes.
Detailed
Regionalization of IDF/DDF Relationships
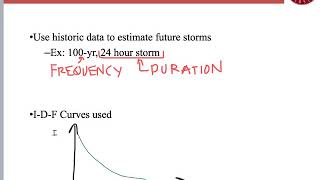
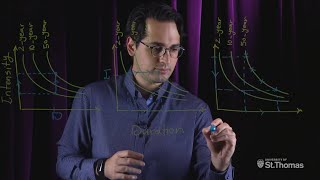
In hydrology, the Intensity-Duration-Frequency (IDF) and Depth-Duration-Frequency (DDF) relationships are critical for estimating rainfall values relevant to drainage and flood control design. However, since rainfall characteristics differ across regions, creating regional IDF or DDF curves is essential. This section discusses the process of regionalization, which involves several key steps:
- Dividing Regions: The entire area of interest must be subdivided into homogeneous rainfall zones that exhibit similar rainfall behavior.
- Data Analysis: Long-term rainfall data from representative rain gauges within each zone is collected and analyzed. This ensures that the data reflects the specific characteristics of each region.
- Fitting the IDF Equation: Using regional regression techniques, appropriate statistical methods are applied to fit the IDF equation to the gathered data. This yields parameters that are more reflective of local conditions than generalized values.
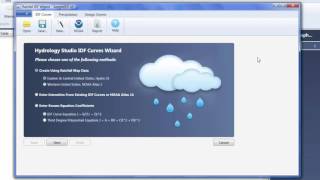
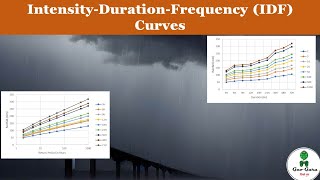
- Isopluvial Maps: Finally, the results are visualized through the development of isopluvial maps, which depict lines of equal rainfall depth or intensity for different durations and frequencies. These maps are invaluable for engineers and hydrologists when estimating design storms, particularly in ungauged locations or for specific urban drainage and flood management applications.
Understanding regionalization is crucial for effective water resource planning and hydrological design, optimizing both the safety and efficiency of stormwater management systems.
Youtube Videos


Audio Book
Dive deep into the subject with an immersive audiobook experience.
Importance of Regionalization
Chapter 1 of 2
🔒 Unlock Audio Chapter
Sign up and enroll to access the full audio experience
Chapter Content
Because rainfall characteristics vary across regions, regional IDF curves are necessary.
Detailed Explanation
Rainfall characteristics, such as intensity and duration, are not the same everywhere. Different geographical areas have unique weather patterns that affect how rain falls. For effective planning and designing of drainage systems, engineers and hydrologists must consider these regional differences. Therefore, regional IDF curves, which account for local rainfall behavior, are essential for accurate hydrological modeling.
Examples & Analogies
Think of regionalization as understanding how different neighborhoods have their own unique characteristics. Just like how some neighborhoods may experience more traffic or have more parks, different regions have unique rainfall patterns. If you were planning a party in a neighborhood, you'd take into account its specific characteristics to make sure it goes smoothly. Similarly, hydrologists need to tailor their rainfall models based on regional data.
Steps in Regionalization
Chapter 2 of 2
🔒 Unlock Audio Chapter
Sign up and enroll to access the full audio experience
Chapter Content
Steps in Regionalization:
1. Divide the entire region into homogeneous rainfall zones.
2. Analyze long-term data from representative rain gauges.
3. Fit the IDF equation using regional regression techniques.
4. Develop isopluvial maps for visualizing spatial distribution.
Detailed Explanation
The process of regionalization involves several key steps:
1. Divide the Region: The first step is to split the area of interest into smaller sections with similar rainfall characteristics, known as homogeneous rainfall zones. This helps to ensure that the rainfall patterns are consistent within each zone.
2. Analyze Data: Next, hydrologists collect and analyze long-term rainfall data from representative rain gauges in each zone. This data provides a statistical basis for understanding rainfall behavior over time.
3. Fit the IDF Equation: After gathering data, they fit the IDF equation to this data using regression techniques specific to that region. This step helps in modeling the expected rainfall intensity for given durations and return periods accurately.
4. Develop Isopluvial Maps: Finally, isopluvial maps are created to visualize how rainfall depth or intensity changes across the region. These maps use lines of equal rainfall to depict areas that experience similar amounts of rainfall, making it easier to understand spatial distribution.
Examples & Analogies
Imagine you're planning a hike across different terrains. First, you'd study maps to divide the hike into sections based on the type of land (mountains, forests, or plains). Next, you'd gather weather data for each section to prepare for different conditions. After analyzing the weather data, you’d prepare your hiking gear specifically for each terrain section. Finally, you draw out a detailed map showing where the weather conditions might change, allowing you to plan your journey effectively. Similarly, in regionalization, understanding and visualizing the rainfall data helps hydrologists prepare more accurate water management strategies.
Key Concepts
-
Regionalization: The process of tailoring IDF/DDF relationships to specific geographic areas.
-
Isopluvial Maps: Tools to visualize rainfall distributions, essential for effective hydrological management.
-
Homogeneous Rainfall Zones: Areas created to ensure that rainfall characteristics are similar when analyzing data.
Examples & Applications
Regional analysis of IDF curves for a metropolitan area considering urban climate effects.
Development of isopluvial maps to assess rainfall variability across a watershed.
Memory Aids
Interactive tools to help you remember key concepts
Rhymes
To manage floods and drainage too, regional data is what we pursue!
Stories
Once upon a time in Rainforest Valley, different animals had varying rainfall needs. The wise owl advised them to form groups based on their differences to understand better how much rain they needed, leading to their happy coexistence.
Memory Tools
For IDF setup, think of 'G.D.R.M.': Gather Data, Regionalize, Model. These steps guide our approach in regionalization.
Acronyms
H.R.D. - Homogeneous Rainfall Division reminds us to classify areas for more accurate analysis.
Flash Cards
Glossary
- Regionalization
The process of creating regional IDF/DDF curves based on localized rainfall characteristics.
- Isopluvial Map
A map that depicts lines of equal rainfall depth or intensity for specific durations and frequencies.
- Homogeneous Rainfall Zone
A subdivision of an area where rainfall characteristics are similar.
- Regional Regression Techniques
Statistical methods used to fit IDF equations to localized data to create accurate rainfall estimates.
Reference links
Supplementary resources to enhance your learning experience.