
Flow Duration Curves
Enroll to start learning
You’ve not yet enrolled in this course. Please enroll for free to listen to audio lessons, classroom podcasts and take practice test.
Interactive Audio Lesson
Listen to a student-teacher conversation explaining the topic in a relatable way.
Introduction to Flow Duration Curves
🔒 Unlock Audio Lesson
Sign up and enroll to listen to this audio lesson

Today we're discussing Flow Duration Curves, or FDCs for short. Can anyone tell me what an FDC represents?

Isn't it about how much water flows in a river over time?
Great start! An FDC indeed relates to streamflow. Specifically, it shows the percentage of time a specific streamflow level is equaled or exceeded. This is crucial for various applications in hydrology.

So, how is it constructed?
Excellent question! To construct an FDC, we start by collecting streamflow data, then rank it. Let's remember this with the acronym 'DRIP': Data collection, Ranking, Identify exceedance probability, Plotting.

What does 'exceedance probability' mean?
Exceedance probability is the chance that a certain flow level is met or exceeded. For instance, if we know a flow of 100 cubic meters per second is only met in 40% of measurements, we can strategize around this knowledge.

Could this help in drought planning?
Absolutely! FDCs can be extremely helpful in assessing hydropower potential and environmental flow, ensuring that resources are utilized responsibly.
To summarize, FDCs are tools to analyze how streamflow varies over time, constructed through ranking flow data and calculating exceedance probabilities. They are critical for effective water resource management.
Uses of Flow Duration Curves
🔒 Unlock Audio Lesson
Sign up and enroll to listen to this audio lesson

Now that we understand how to construct an FDC, let's discuss its applications. Who can name a few ways FDCs are used in hydrology?
I think it's used for assessing water supply?
Correct! FDCs help evaluate the reliability of water supplies. They also assist in hydropower assessments—this can be summed up with the phrase 'SAVE': Supply, Assess hydropower, Verify environmental flows, Evaluate system reliability.
How does it help in reservoir design?
FDCs inform us about the expected water availability for reservoir planning. By understanding flow variability, engineers can design reservoirs that meet demand even during low-flow conditions.
Do FDCs also consider the impact of climate change?
Indeed! Analyzing historical FDCs can help predict changes in water availability due to climate variations. It’s essential for future-proofing water resource systems.
In summary, we’ve explored several key applications of Flow Duration Curves—using it for water supply reliability, hydropower assessment, reservoir design, and adapting to climate change.
Introduction & Overview
Read summaries of the section's main ideas at different levels of detail.
Quick Overview
Standard
Flow Duration Curves are crucial tools in hydrology, showing how often streamflows reach certain levels over time. They are widely used in applications such as hydropower assessments, reservoir design, and environmental flow analysis, allowing stakeholders to predict water availability and system reliability.
Detailed
Flow Duration Curves
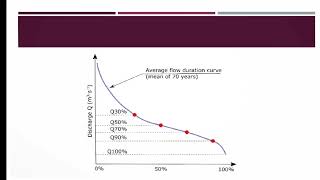
Flow Duration Curves (FDC) are important graphical tools used in hydrology to represent the percentage of time that a specific streamflow is equaled or exceeded during a defined period. This section outlines the construction steps, types, and various uses of FDC, highlighting its significance in evaluating hydropower potential, reservoir design, and the reliability of water supply systems.
Construction Steps
To create an FDC, one must:
1. Collect streamflow data (daily/monthly).
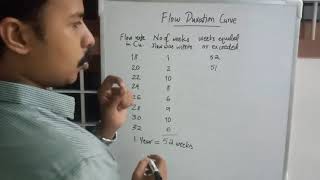
2. Rank the data from highest to lowest.
3. Calculate the exceedance probability using the formula:
$$P = \frac{m}{n + 1} \times 100$$
where $m$ is the rank and $n$ is the total number of observations.
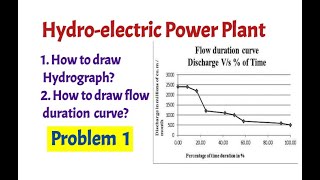
4. Plot the discharge against the exceedance probability.
Uses
FDCs serve multiple purposes, including:
- Hydropower potential assessment: Evaluating how often streams can be used for energy generation.
- Reservoir design: Aiding in planning water storage capacity.
- Environmental flow analysis: Ensuring ecological integrity by analyzing the natural flow patterns.
- Evaluation of water supply systems: Measuring the reliability of water availability.
Types of FDCs
- Daily FDC: Illustrates short-term flow variability.
- Monthly/Annual FDC: Highlights long-term trends and resource availability.
The understanding and application of Flow Duration Curves are vital for effective water resources management, enabling efficient planning and operation of terrestrial and hydro-engineered systems.
Youtube Videos


Audio Book
Dive deep into the subject with an immersive audiobook experience.
Definition of Flow Duration Curve (FDC)
Chapter 1 of 4
🔒 Unlock Audio Chapter
Sign up and enroll to access the full audio experience
Chapter Content
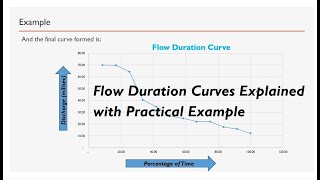
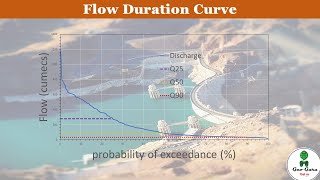
A Flow Duration Curve (FDC) is a graphical representation showing the percentage of time a particular streamflow is equaled or exceeded during a given period.
Detailed Explanation
The Flow Duration Curve (FDC) is a tool used in hydrology to analyze streamflow data. It helps visualize how often specific flow rates occur over time. By plotting the streamflow data, we are able to see which flow rates are most common and which are rare. This gives valuable insights into the water resource availability, which is crucial for managing water systems.
Examples & Analogies
Imagine you're monitoring the amount of water that flows from a faucet in your kitchen throughout the day. An FDC would allow you to chart how often the water flows at different rates: whether it flows quickly during peak usage times (like morning) and more slowly at night. This information can help you understand your daily water needs and adjust your usage accordingly.
Construction Steps of FDC
Chapter 2 of 4
🔒 Unlock Audio Chapter
Sign up and enroll to access the full audio experience
Chapter Content
- Collect streamflow data (daily/monthly).
- Rank data from highest to lowest.
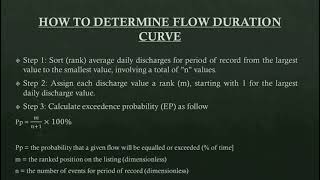
- Assign exceedance probability:
P = (m / (n + 1)) × 100
• Where:
– m = rank
– n = total number of observations - Plot discharge (Q) vs. exceedance probability (P).
Detailed Explanation
The construction of a Flow Duration Curve involves several steps. First, you gather data on streamflow, which can be daily or monthly measurements. Next, the data is arranged from the highest flow to the lowest. After ranking the data, you calculate the exceedance probability for each flow rate, which tells you how often a flow rate is equaled or exceeded over the entire data set. Finally, these values are plotted on a graph, with flow rates on one axis and exceedance probabilities on the other, creating the FDC.
Examples & Analogies
Think of it like preparing a report card for your grades over the semester. You collect all your grades (streamflow data), list them from highest to lowest (ranking), and then calculate what percentage of the time you scored above a certain grade (exceedance probability). When you're done, you have a visual chart that shows which grades were most common throughout the semester.
Uses of Flow Duration Curves
Chapter 3 of 4
🔒 Unlock Audio Chapter
Sign up and enroll to access the full audio experience
Chapter Content
• Hydropower potential assessment.
• Reservoir design.
• Environmental flow analysis.
• Reliability of water supply systems.
Detailed Explanation
Flow Duration Curves have several important applications in water resource management. They can help assess the potential for generating hydropower by indicating how much water is available over time. They are essential in designing reservoirs, as engineers need to know the variability in flow to ensure sufficient storage capacity. Additionally, FDCs are used to analyze environmental flows, ensuring ecosystems receive the water they need. Lastly, they contribute to understanding and planning for the reliability of water supply systems, guiding decisions on infrastructure and resource allocation.
Examples & Analogies
Imagine a utility company planning to build a reservoir to store water for a city. By using an FDC, they can understand the variations in river flow throughout the year. This way, they can design the reservoir to hold enough water to supply the city during dry periods while also ensuring they don't over-design, wasting resources. It’s like knowing how much food you need to store at home based on how busy you typically are throughout the week.
Types of Flow Duration Curves
Chapter 4 of 4
🔒 Unlock Audio Chapter
Sign up and enroll to access the full audio experience
Chapter Content
• Daily FDC: Shows short-term flow variability.
• Monthly/Annual FDC: Highlights long-term trends and resource availability.
Detailed Explanation
There are different types of Flow Duration Curves depending on the time frame of the data used. Daily FDCs are useful for understanding short-term streamflow variability, capturing fluctuations in flow day-to-day. On the other hand, monthly or annual FDCs focus on longer-term trends, helping identify patterns and resource availability over more extended periods. This differentiation is vital for appropriately managing water resources and understanding seasonal changes.
Examples & Analogies
Consider a chef preparing a menu. A daily FDC is like adjusting a daily menu based on immediate customer feedback. A monthly or annual FDC is like analyzing which dishes were most popular over several months to create the best seasonal menu. Understanding both short-term and long-term trends helps in making decisions that satisfy customers while maximizing resources.
Key Concepts
-
Flow Duration Curve (FDC): A tool that provides information on how often flow levels are equaled or exceeded over time.
-
Exceedance Probability: A concept used to determine the frequency of specific streamflow measurements.
Examples & Applications
An FDC can show that a river's flow is equal to or exceeds 100 cubic meters/second for 30% of the time, indicating opportunities for hydropower generation during that period.
Using an FDC, engineers might determine that a reservoir should be designed to accommodate flows below a certain level that is anticipated to occur 10% of the time.
Memory Aids
Interactive tools to help you remember key concepts
Rhymes
When flows are high and we want to see, FDC shows the frequency!
Stories
Imagine a river telling tales of its flow—sometimes high, sometimes low, the FDC shows how often each tale will show!
Memory Tools
Use 'D-R-I-P' to remember the steps for constructing an FDC: Data collection, Ranking, Identify exceedance probability, Plotting.
Acronyms
'SAVE' to remember uses
Supply assessments
Hydropower assessments
Verify flows
Evaluate reliability.
Flash Cards
Glossary
- Flow Duration Curve (FDC)
A graphical representation showing the percentage of time that streamflow is equaled or exceeded.
- Exceedance Probability
The likelihood that a particular streamflow level is met or exceeded over a specified period.
- Cumulative Runoff Volume
The total amount of runoff collected over a specified time period.
Reference links
Supplementary resources to enhance your learning experience.