
Runoff
Enroll to start learning
You’ve not yet enrolled in this course. Please enroll for free to listen to audio lessons, classroom podcasts and take practice test.
Interactive Audio Lesson
Listen to a student-teacher conversation explaining the topic in a relatable way.
Components of Runoff
🔒 Unlock Audio Lesson
Sign up and enroll to listen to this audio lesson

Today, we'll begin with the three main components of runoff: surface runoff, interflow, and base flow. Can anyone tell me what surface runoff is?

Isn't that when water flows over the ground immediately after it rains?
Exactly! This occurs when the rainfall intensity is too high for the soil to absorb. Now, what about interflow?

Interflow happens when water moves through the soil layers but isn't seen on the surface until later.
Well said! Interflow can take hours to days to contribute to streamflow after precipitation. Lastly, can someone explain base flow?

Base flow is the water from underground that keeps rivers flowing during dry periods, right?
Correct! Remember, surface runoff is immediate, interflow is postponed, and base flow is sustained groundwater flow. Keeping these terms in mind will help us as we move forward.
Factors Affecting Runoff
🔒 Unlock Audio Lesson
Sign up and enroll to listen to this audio lesson

Now, let’s discuss the factors that affect runoff. Can anyone name some climatic factors?

Rainfall intensity and duration!
Right! Intense rainfall can create more runoff. What about physiographic factors?
Topography! Steeper slopes mean faster runoff.
Excellent! And how does vegetation cover influence runoff?
More vegetation reduces runoff because it helps absorb water.
Exactly! Vegetation increases infiltration. Remember the acronym 'CLIPP' for Climatic, Land use, Interception, Physiographic, and Previous conditions that affect runoff!
SCS-CN Method of Estimating Runoff
🔒 Unlock Audio Lesson
Sign up and enroll to listen to this audio lesson
Let’s dive into the SCS-CN method. What do you think could be some assumptions of this method?
It likely assumes a direct relationship between rainfall, retention, and runoff.
Correct! This method also considers land use and moisture conditions. Can someone summarize the key equations used?
The equations calculate runoff depth using initial abstraction and potential maximum retention.
Exactly! Remember: Q = (P - I)² / (P - I + S) for calculating runoff. The simplicity and low data requirement make it quite valuable. Now, can someone state a limitation of this method?
It's sensitive to the CN values, and getting it wrong can lead to big errors in the results!
Great point! So keep that in mind when estimating runoff using the SCS-CN method.
Flow Duration Curves & Mass Curves
🔒 Unlock Audio Lesson
Sign up and enroll to listen to this audio lesson
Finally, let’s talk about Flow Duration Curves. What is the purpose of a flow duration curve?
It shows how often a specific streamflow is reached or exceeded over time.
Exactly, and how do we construct one?
We rank flow data from highest to lowest and then calculate the exceedance probability.
Right! Now let’s move on to mass curves. What are mass curves used for?
They help in identifying storage requirements for reservoirs.
Correct! The greatest distance between the demand line and the mass curve indicates required storage. Great job, everyone, let’s quickly recap the key points!
Introduction & Overview
Read summaries of the section's main ideas at different levels of detail.
Quick Overview
Standard
This section examines runoff's classification, its influencing factors, methods for estimating basin yield, and analysis techniques like flow duration curves and mass curves, crucial for effective water resource management.
Detailed
Detailed Overview of Runoff
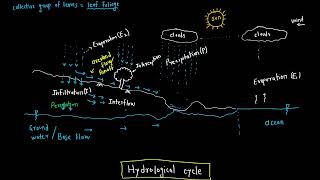
Runoff is a pivotal aspect of the hydrological cycle, serving as the pathway through which precipitation drains into rivers, lakes, and oceans. In this section, we explore the components of runoff, which include surface runoff, interflow, and base flow. Surface runoff occurs when rainfall intensity surpasses the soil's infiltration capacity, leading to immediate overflow. Conversely, interflow refers to the water flowing laterally through the upper soil before contributing to streamflow, while base flow represents the groundwater feeding rivers during dry spells.
Several factors, both climatic and physiographic, impact runoff generation, such as rainfall characteristics, soil type, vegetation cover, and land use. We also discuss basin yield, defining it as the total water volume extractable from a river basin. Two main types of basin yield are 'safe yield' and 'ultimate yield', assessed using empirical methods and hydrological modeling. The SCS-CN method is introduced to estimate runoff, emphasizing key equations and advantages, particularly its simplicity and limited data requirements. Finally, flow duration curves and mass curves are described as analytical tools for assessing streamflow variability and storage requirements, outlining their construction and applications.
Youtube Videos


Audio Book
Dive deep into the subject with an immersive audiobook experience.
Introduction to Runoff
Chapter 1 of 7
🔒 Unlock Audio Chapter
Sign up and enroll to access the full audio experience
Chapter Content
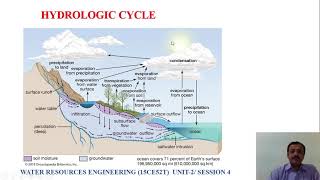
Runoff is a key component of the hydrological cycle and plays a vital role in water resources engineering. It represents the portion of precipitation that flows over the land surface towards rivers, lakes, or oceans. Understanding runoff is essential for the planning, design, and management of water resource systems, especially in flood control, irrigation, drainage, and hydropower generation. The characteristics of runoff are influenced by various natural and anthropogenic factors. This chapter discusses the major components of runoff, the factors affecting runoff, methods to estimate basin yield, the SCS-Curve Number (SCS-CN) method, and the analysis techniques using flow duration curves and mass curves.
Detailed Explanation
Runoff is essentially water that doesn't soak into the ground after it rains. Instead, it flows over the surface and enters bodies of water like rivers and lakes. It's crucial for activities like flood control and irrigation because knowing how much water will run off helps us manage water resources effectively. Runoff is impacted by both natural events (like rainfall) and human activities (like urban development), and understanding these interactions can help us make better decisions regarding water management and engineering.
Examples & Analogies
Think of runoff like a sponge. When you pour water on a sponge (like rain on the ground), the sponge soaks up some water (infiltration), but if you pour too fast, water will drip off the sides. This dripping water is similar to runoff, which occurs when the ground can't absorb all the rain.
Components of Runoff
Chapter 2 of 7
🔒 Unlock Audio Chapter
Sign up and enroll to access the full audio experience
Chapter Content
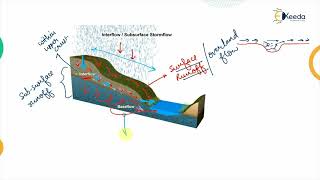
Runoff can be classified into three primary components based on the source and timing of flow:
1. Surface Runoff
- Also known as overland flow.
- It occurs when rainfall intensity exceeds the infiltration capacity of the soil.
- Surface runoff is the most visible and immediate form of runoff and is responsible for flash floods.
2. Interflow (Subsurface Runoff)
- This is the lateral movement of water through the upper soil layers before it enters the stream channel.
- It generally contributes to streamflow hours or days after the precipitation event.
- Influenced by soil porosity, vegetation, and slope.
3. Base Flow
- Also called groundwater runoff.
- It sustains river flows during dry periods and originates from groundwater seeping into stream channels.
- It represents the long-term storage component of the hydrological cycle.
Detailed Explanation
Runoff can be divided into three types. First, we have surface runoff, which is the immediate water flow that happens when it rains heavily, leading to quick water accumulation on the surface. This is often what causes flash floods. Next is interflow, which is water that moves through the soil before reaching streams, contributing to water flow at a delay. Finally, base flow refers to water that comes from deep underground sources. This maintains river levels during dry seasons, acting as a reservoir of water.
Examples & Analogies
Imagine a sponge on a surface. When you pour water on it (rain), the first bit runs off the edge (surface runoff). Then, after a while, some water seeps through the sponge and into the container below (interflow), which you see later as a slow trickle. Meanwhile, the sponge itself holds water which you can squeeze out later (base flow).
Factors Affecting Runoff
Chapter 3 of 7
🔒 Unlock Audio Chapter
Sign up and enroll to access the full audio experience
Chapter Content
Several factors influence the generation and magnitude of runoff. These factors can be grouped into:
A. Climatic Factors
- Rainfall intensity, duration, and distribution: High-intensity storms generate more surface runoff.
- Temperature: Influences evapotranspiration and snowmelt.
- Wind and humidity: Affect evaporation rates and soil moisture conditions.
B. Physiographic Factors
- Topography: Steeper slopes lead to faster runoff; flat terrains encourage infiltration.
- Soil Type: Sandy soils have high infiltration rates; clayey soils promote surface runoff.
- Vegetation Cover: Dense vegetation reduces runoff by enhancing infiltration and interception.
- Land Use and Urbanization: Impervious surfaces increase surface runoff and reduce infiltration.
C. Basin Characteristics
- Shape and size of the watershed: Compact basins yield faster runoff concentration.
- Drainage density: High drainage density increases runoff collection efficiency.
- Antecedent Moisture Condition (AMC): Previous soil wetness significantly influences runoff yield.
Detailed Explanation
Runoff is affected by various factors grouped into climatic, physiographic, and basin characteristics. Climatic factors include how intense and long it rains, temperature effects on evaporation, and humidity. Physiographic factors involve the landscape's shape, soil types, vegetation, and human activities that can hinder or help water soak into the ground. The characteristics of the basin, such as its shape and moisture conditions, significantly influence how runoff behaves after a rainfall event.
Examples & Analogies
Imagine planning a picnic. If there's heavy rain (climatic factor), you'll see puddles (runoff) right away, but if the ground is dry from past weather (previous moisture), it'll absorb more water. The slope of the ground (physiographic factor) determines how quickly the water collects in one area, just like a sloped picnic table would cause spills to run off more quickly.
Basin Yield
Chapter 4 of 7
🔒 Unlock Audio Chapter
Sign up and enroll to access the full audio experience
Chapter Content
Definition: Basin yield refers to the total volume of water that can be extracted or used from a river basin during a specific period, generally a year, under defined conditions.
Types of Basin Yield
- Safe Yield: Maximum quantity of water that can be withdrawn regularly without depleting the source.
- Maximum/Ultimate Yield: Maximum theoretical quantity of water available from the basin, considering all resources and technologies.
Assessment of Basin Yield
- Empirical methods: Based on historical runoff data.
- Hydrological modeling: Simulates the hydrologic processes using rainfall-runoff models.
- Mass curve analysis and flow-duration curves: Used to determine dependable yield and storage requirements.
Detailed Explanation
Basin yield refers to the amount of water we can safely use from a river basin. There are two types: safe yield, which is the sustainable amount that can be regularly taken out without harming the water source, and maximum yield, which is the total water that could theoretically be used. To determine these yields, methods like analyzing past runoff data or using hydrological models help estimate how much water is available in the future based on different scenarios.
Examples & Analogies
Think of basin yield like a water tank. The safe yield is like knowing how much water you can use daily without running out, while maximum yield is the total water your tank can hold if it rains a lot. Understanding how to manage the tank (your basin) means knowing when to use water and when to save it for later.
SCS-CN Method of Estimating Runoff
Chapter 5 of 7
🔒 Unlock Audio Chapter
Sign up and enroll to access the full audio experience
Chapter Content
The Soil Conservation Service Curve Number (SCS-CN) method, developed by the USDA, is widely used for estimating direct runoff from rainfall events in small catchments.
Assumptions
- A fixed relationship between rainfall, retention, and runoff.
- Based on antecedent moisture condition, land use, and hydrologic soil group.
Key Equations
1. Runoff Depth (Q):
(P −I )2
Q= a for P >I
(P −I +S) a
• Where:
– Q = runoff depth (mm)
– P = rainfall depth (mm)
– I = initial abstraction (mm), typically 0.2S
– S = potential maximum retention (mm)
2. Curve Number (CN) and Storage (S):
S = 25400 - 254/CN
Curve Number (CN)
• Ranges from 30 to 100.
• Depends on land use, soil type, and AMC.
• Tables are available from USDA handbooks.
Advantages
- Simple and easy to apply.
- Requires limited data.
- Widely accepted in watershed and drainage projects.
Limitations
- Best suited for small to medium watersheds.
- Sensitive to CN value; errors in CN selection can lead to significant errors.
Detailed Explanation
The SCS-CN method is a simple way to estimate how much runoff will result from a given rainfall event. It relies on understanding how much water can be absorbed by the soil versus how much runs off. Key components include calculating rainfall, initial absorption, and maximum retention capabilities of the area. While it’s widely used because it’s easy to apply, it's most effective in smaller locations and can be sensitive to inaccuracies in data entry.
Examples & Analogies
Imagine measuring how much water your sponge can hold versus how much will drip off when you pour water on it. The SCS-CN method is like determining exactly how much water will stay in the sponge versus how much will flow off based on various moisture levels and sponge types (representing different land uses and soil types).
Flow Duration Curves
Chapter 6 of 7
🔒 Unlock Audio Chapter
Sign up and enroll to access the full audio experience
Chapter Content
A Flow Duration Curve (FDC) is a graphical representation showing the percentage of time a particular streamflow is equaled or exceeded during a given period.
Construction Steps
1. Collect streamflow data (daily/monthly).
2. Rank data from highest to lowest.
3. Assign exceedance probability:
m
P = ×100
n+1
• Where:
– m = rank
– n = total number of observations
4. Plot discharge (Q) vs. exceedance probability (P).
Uses
- Hydropower potential assessment.
- Reservoir design.
- Environmental flow analysis.
- Reliability of water supply systems.
Types
- Daily FDC: Shows short-term flow variability.
- Monthly/Annual FDC: Highlights long-term trends and resource availability.
Detailed Explanation
A Flow Duration Curve (FDC) helps visualize how often certain streamflow levels happen. By ranking streamflow data and determining how frequently specific flows occur, engineers can design better water management systems. This analysis is useful for evaluating hydropower potential, designing reservoirs, ensuring environmental needs, and maintaining steady water supply reliability.
Examples & Analogies
Think of the FDC like a restaurant menu that lists every dish and the number of times they are ordered. Just like a popular dish might be ordered most frequently, the FDC shows how often specific water flow levels occur. This helps us decide when and how to use our water resources best, similar to how a restaurant decides on stocking popular menu items.
Mass Curve of Runoff – Analysis
Chapter 7 of 7
🔒 Unlock Audio Chapter
Sign up and enroll to access the full audio experience
Chapter Content
A Mass Curve is a plot of cumulative runoff volume (or streamflow) against time. It helps in determining storage requirements for water supply and reservoir planning.
Construction
- Plot cumulative inflow or runoff on Y-axis and time on X-axis.
- Curve shape depends on the variability of inflow.
- Steep slopes indicate high inflow; flat regions show low inflow.
Applications
- Determining reservoir storage requirements:
- Demand line is superimposed on the mass curve.
- The greatest vertical distance between demand line and mass curve gives required storage.
- Identifying periods of surplus and deficit.
Advantages
- Simple graphical method for storage design.
- Can be constructed from historical flow data.
- Useful for analyzing time-distributed flow data.
Detailed Explanation
A Mass Curve plots cumulative water over time to help determine how much storage we need for reservoirs. By comparing inflow and demand for water, we can identify when we have enough water or when we're short. This analysis helps planners understand the hydrological trends and make decisions based on the availability of water at different times.
Examples & Analogies
Consider the Mass Curve like a savings account graph. The curve shows how much money you have (water supply) over time. By plotting your income (inflow) against expenses (demand for water), you can see when you have enough (surplus) or when you’ll run low (deficit). This way, you can plan your finances wisely, just like planners manage water resources.
Key Concepts
-
Surface Runoff: The immediate flow of water over land due to excess rainfall.
-
Interflow: Water movement through upper soil layers that contributes to streamflow later.
-
Base Flow: The sustained contribution of groundwater to rivers during dry periods.
-
Basin Yield: The volume of water extractable from a watershed under specific conditions.
-
SCS-CN Method: A straightforward method for estimating runoff based on regional factors.
-
Flow Duration Curve: A graphical representation of streamflow variability over time.
-
Mass Curve: A tool for analyzing cumulative runoff volumes to assess storage needs.
Examples & Applications
When a heavy rainstorm occurs, the water that does not infiltrate into the ground causes surface runoff, which can lead to flooding.
A region with clay soil types will typically see more surface runoff compared to sandy soils, which allow for better absorption.
Memory Aids
Interactive tools to help you remember key concepts
Rhymes
When it rains, the ground can't hold, Surface runoff, a story told. Interflow comes much later, you see, Base flow keeps rivers full as can be.
Stories
Imagine a heavy rain falls on a steep hill. Water rushes down in a flurry—this is surface runoff. Some water seeps through the soil slowly and joins the stream later; that's interflow. Finally, when it's dry, the rivers still flow, being fed by groundwater, which is base flow.
Memory Tools
Remember 'SIB' for runoff components: Surface, Interflow, Base flow.
Acronyms
Use 'RIBS' to recall the components affecting runoff
Rainfall
Infiltration
Basin Shape.
Flash Cards
Glossary
- Runoff
The portion of precipitation that flows over the land surface towards rivers, lakes, or oceans.
- Surface Runoff
Water flow that occurs when rainfall intensity exceeds the infiltration capacity of the soil.
- Interflow
The lateral movement of water through the upper soil layers before entering a stream channel.
- Base Flow
Groundwater flow that contributes to river flow during dry periods.
- Basin Yield
The total volume of water that can be extracted from a river basin under defined conditions.
- SCSCN Method
A method used for estimating direct runoff from rainfall events based on soil characteristics and moisture conditions.
- Flow Duration Curve (FDC)
A graphical representation showing the percentage of time a certain streamflow rate is equaled or exceeded.
- Mass Curve
A plot of cumulative runoff volume against time, used for storage requirement analysis.
Reference links
Supplementary resources to enhance your learning experience.