
Mass Curve of Runoff – Analysis
Enroll to start learning
You’ve not yet enrolled in this course. Please enroll for free to listen to audio lessons, classroom podcasts and take practice test.
Interactive Audio Lesson
Listen to a student-teacher conversation explaining the topic in a relatable way.
Introduction to Mass Curve
🔒 Unlock Audio Lesson
Sign up and enroll to listen to this audio lesson

Today, we're going to explore the Mass Curve, which is a graphical tool used in hydrology to analyze cumulative runoff volumes. Can anyone tell me what cumulative runoff volume means?

Is it the total amount of water that has flowed over an area?
Exactly! And when we graph this over time, we can really see patterns in water flow. So, what do you think the curve might look like if there's a lot of rain?

It would probably have steep sections where the inflow is high!
Correct! Steep slopes indicate high inflow, and flatter areas indicate lower inflow. This helps us understand storage requirements for reservoirs.

How do we find out how much storage we need?
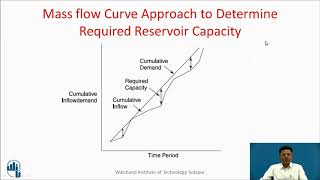
Great question! By superimposing a demand line on the Mass Curve, we can see the maximum distance between that line and the Mass Curve itself to determine storage needs. Remember this as 'Distance = Demand - Curve'!

So, if the demand exceeds the curve, we know we need more storage, right?
Yes! Excellent takeaway! Let's summarize: The Mass Curve visualizes total runoff over time, helping us assess water storage needs.
Applications of Mass Curves
🔒 Unlock Audio Lesson
Sign up and enroll to listen to this audio lesson

Now that we've covered what the Mass Curve is, let’s talk about its applications. Why are Mass Curves particularly useful in reservoir planning?
Because they help predict how much water will flow into the reservoir!
And they can show us when there might be too much or too little water!
Absolutely! With this information, we can determine not just storage requirements but also identify periods of surplus or deficit. Who can give me an example of a surplus period?
After a heavy rainstorm, right?
Exactly! And during those times, we might need to release excess water from the reservoir. Similarly, during dry spells, we need to manage water levels carefully.
So, the Mass Curve is also used for ensuring a reliable water supply?
Yes! That’s another critical application. Let's recap: the Mass Curve aids in reservoir planning, managing surplus, and ensuring water reliability.
Construction of Mass Curve
🔒 Unlock Audio Lesson
Sign up and enroll to listen to this audio lesson
To construct a Mass Curve, we need to follow a few critical steps. What do you think would be our first step?
Collecting data on inflow or runoff?
Correct! We start by gathering cumulative inflow or runoff data. Next?
Plotting it on a graph?
Exactly! The cumulative volume goes on the Y-axis and time on the X-axis. What happens if we have inconsistent inflow data?
It might make our curve look confusing!
Right! Therefore, understanding trends is vital. And at the end, we can analyze the shape of the curve to interpret inflow conditions. Recap time: What are the steps to construct our Mass Curve?
Collect data, plot cumulative inflow over time, and analyze the curve!
Perfect summary!
Introduction & Overview
Read summaries of the section's main ideas at different levels of detail.
Quick Overview
Standard
This section discusses the construction and applications of the Mass Curve in runoff analysis, highlighting its significance in reservoir storage requirements, identification of surplus and deficit periods, and its simple graphical nature derived from historical flow data.
Detailed
Detailed Summary of Mass Curve of Runoff – Analysis
A Mass Curve is an essential tool in hydrology, specifically used to analyze cumulative runoff volume against time. By plotting cumulative inflow or runoff on the Y-axis and time on the X-axis, one can visually interpret inflow variability—a steep slope indicates high inflow, while flat regions correspond to low inflow. The technique is particularly useful in determining necessary storage for reservoirs: by overlaying a demand line on the mass curve, the maximum vertical distance between the two indicates the required storage capacity. Moreover, this graphical method not only facilitates the planning of reservoirs but also allows for the identification of periods with surplus or deficit flows, providing invaluable insight for water resource management. The Mass Curve's simplicity and reliance on historical data make it an effective tool in analyzing time-distributed flow data.
Youtube Videos


Audio Book
Dive deep into the subject with an immersive audiobook experience.
Mass Curve Definition
Chapter 1 of 4
🔒 Unlock Audio Chapter
Sign up and enroll to access the full audio experience
Chapter Content
A Mass Curve is a plot of cumulative runoff volume (or streamflow) against time.
Detailed Explanation
A Mass Curve is a visual representation that helps in understanding how much water is produced over time in a specific watershed area. The plot shows cumulative amounts of water that flow into a river or reservoir, which provides vital insights into how water resources fluctuate over a given period. Essentially, you look at how much water flows into a system, like a river, and track that total amount over time.
Examples & Analogies
Imagine keeping a jar to collect rainwater for your garden. Each time it rains, you measure how much water has collected in the jar. Over time, you can draw a graph that shows the total amount of rainy days, showing your garden’s water supply over time just like the Mass Curve shows cumulative flow.
Construction of Mass Curve
Chapter 2 of 4
🔒 Unlock Audio Chapter
Sign up and enroll to access the full audio experience
Chapter Content
To construct a mass curve, plot cumulative inflow or runoff on the Y-axis and time on the X-axis. The curve shape depends on the variability of inflow. Steep slopes indicate high inflow; flat regions show low inflow.
Detailed Explanation
When constructing a Mass Curve, you start by plotting the total amount of runoff on the vertical axis (Y-axis) and the corresponding periods of time on the horizontal axis (X-axis). If the line in the graph is steep, it indicates that a lot of water is flowing into the system rapidly. Conversely, if the line is flat, it indicates that the inflow is low or perhaps that there hasn't been much rain lately.
Examples & Analogies
Think of it like tracking your bank savings. If you deposit a lot of money quickly, your savings line climbs steeply. If you hardly ever add any money, that line barely rises. The steeper the line, the more deposits you are making, just as steep slopes in a mass curve indicate high water inflow.
Applications of Mass Curves
Chapter 3 of 4
🔒 Unlock Audio Chapter
Sign up and enroll to access the full audio experience
Chapter Content
Mass curves are used for determining reservoir storage requirements. A demand line is superimposed on the mass curve. The greatest vertical distance between the demand line and mass curve gives required storage. Other applications include identifying periods of surplus and deficit.
Detailed Explanation
Mass curves play an important role when planning for water storage in reservoirs. By overlaying a line that indicates the water demand for a given period (the demand line), planners can easily see how much storage capacity they will need. The space between the mass curve and this demand line shows the amount of additional water storage that may be necessary to meet demand during peak usage times, thereby helping in efficient water resource management.
Examples & Analogies
Consider a person who needs to regularly fill a water tank for their home water usage. By plotting how much water they typically use over time against how much water collects from rain, they can see if their rainwater collection is sufficient. The gap between what they collect and what they need helps them decide if they need a bigger tank.
Advantages of Mass Curves
Chapter 4 of 4
🔒 Unlock Audio Chapter
Sign up and enroll to access the full audio experience
Chapter Content
Mass curves offer a simple graphical method for storage design, can be constructed from historical flow data, and are useful for analyzing time-distributed flow data.
Detailed Explanation
One of the significant benefits of using Mass Curves is their straightforwardness; they visually represent data in a way that makes it easy to analyze how much water needs to be stored over time. Because they can be created using past flow data, they serve as a valuable tool for planning and making informed predictions for future water storage needs based on historical patterns.
Examples & Analogies
Think about a farmer who uses past weather data to decide how much grain to store for the next year. By looking at historical rainfall patterns shown in a curve, they can determine how much extra grain they might need when rains were less abundant, ensuring they are prepared for the future challenges.
Key Concepts
-
Mass Curve: A tool for visualizing cumulative runoff flows over time.
-
Cumulative Runoff: Total water runoff accumulated in a given period.
-
Demand Line: Represents the expected water use over time.
-
Reservoir Storage Requirements: The necessary volume to adequately manage water for demand.
Examples & Applications
A Mass Curve can be constructed using historical rainfall data to predict future inflow behavior for reservoir planning.
One can identify surplus periods during rainy seasons when inflow exceeds the demand indicated by the demand line.
Memory Aids
Interactive tools to help you remember key concepts
Rhymes
When rains descend and flows increase, the Mass Curve shows, so we can release.
Stories
Imagine a farmer checks his fields after a storm; he sees the water levels rise rapidly—he marks the curves to remember how much he needs to store for drier days ahead.
Memory Tools
Remember 'DUMP' for Demand, Understand, Model, Plot – the crucial steps for using a Mass Curve!
Acronyms
CUMULUS
Cumulative Upward Movement Indicates Long Use of Storage.
Flash Cards
Glossary
- Mass Curve
A graphical plot of cumulative runoff volume against time, used for analyzing inflow variability and storage requirements.
- Cumulative Runoff
The total volume of water runoff accumulated over a specific time period.
- Demand Line
A horizontal line plotted on a Mass Curve representing the required water demand.
- Reservoir Storage Requirements
The volume of water necessary to meet demand during periods of high consumption and low inflow.
Reference links
Supplementary resources to enhance your learning experience.