
Spectroscopic Evidence for Atomic Models
Enroll to start learning
You’ve not yet enrolled in this course. Please enroll for free to listen to audio lessons, classroom podcasts and take practice test.
Interactive Audio Lesson
Listen to a student-teacher conversation explaining the topic in a relatable way.
Introduction to Spectroscopy
🔒 Unlock Audio Lesson
Sign up and enroll to listen to this audio lesson

Today, we're diving into spectroscopy, which involves the interaction between light and matter. Can anyone tell me why it's essential for understanding atomic models?

It helps us see how atoms emit and absorb light, right?
Exactly! Spectroscopy allows us to observe discrete spectral lines, which provide evidence for quantized energy levels. Let's explore emission and absorption spectra.

What do you mean by discrete spectral lines?
Great question! When electrons move between energy levels, they either emit or absorb photons corresponding to specific energy differences, resulting in these distinct lines. This highlights the quantized nature of atomic energy levels.

So, does that mean every element has a unique spectrum?
Absolutely! Each element has its unique emission and absorption spectra, just like a fingerprint. This characteristic pattern helps identify elements in various contexts.
To remember, think of the acronym 'EARS'—Emission absorbs, resulting in spectra—that emphasizes how these processes allow us to study atomic structures.
In summary, spectroscopy is crucial in revealing how light interacts with atoms, showcasing energy level transitions through discrete spectral lines.
Emission and Absorption Spectra
🔒 Unlock Audio Lesson
Sign up and enroll to listen to this audio lesson

Let's now delve deeper into how emission and absorption spectra work. Who can explain the emission process?

When an atom in an excited state drops to a lower energy state, it emits a photon, right?
Correct! The energy of that photon is equal to the difference in those energy states. Conversely, how does absorption happen?
An electron absorbs a photon that has just the right energy to jump up to a higher energy level.
Exactly! And this process creates dark lines in the absorption spectrum where specific wavelengths are absent. Think of these lines as the 'missing pieces' in a continuous spectrum.
Let's use 'LADA' as a memory aid—Light Absorption, Dark Appearance—to recall that absorption results in dark lines.
Summarizing, emission spectra show bright lines due to energy release, while absorption spectra reveal dark lines where energy is absorbed.
Hydrogen Spectral Series
🔒 Unlock Audio Lesson
Sign up and enroll to listen to this audio lesson
Now, let's focus specifically on hydrogen's spectral series. Why is hydrogen such a crucial element for studying spectra?
Because it’s simple, with only one electron, making it easier to analyze.
Right! The hydrogen spectral series includes the Lyman series in the ultraviolet, Balmer in the visible, and Paschen in the infrared, among others. Each corresponds to transitions between specific energy levels.
How do we calculate the wavelengths for these transitions?
Using the Rydberg formula! It connects the energy levels to the wavelengths of light emitted. To help remember, think 'R for Rydberg, R for Radiating light.'
Can you give me an example of a wavelength from the Balmer series?
Certainly! The transition from n=3 to n=2 results in a wavelength of about 656.3 nm, seen as the prominent H-alpha line. This example highlights how spectroscopic data directly corresponds to energy transitions.
In summary, the hydrogen spectral series exemplifies how distinct transitions lead to unique emissions and illuminates fundamental principles of atomic structure.
Fine Structure and Multi-Electron Atoms
🔒 Unlock Audio Lesson
Sign up and enroll to listen to this audio lesson
Moving on, let's explore the fine structure seen in spectral lines and how it applies to multi-electron atoms. Who can define fine structure?
It refers to small splittings in spectral lines due to quantum mechanical effects like spin-orbit coupling?
Exactly! These small shifts arise from the intricate interactions of electrons. Multi-electron atoms are even more complex because we must also consider electron-electron repulsion.
How does this complexity show up in their spectra?
Each electron's energy level is influenced by others, leading to different split patterns that can’t be simply predicted by simple models like Bohr’s. This shows that the quantum mechanical model provides a better understanding.
As a mnemonic, think 'FINE' for Fine structure indicating 'Interactions Nurturing Energy levels.' This reinforces that interactions shape our understanding of atomic structures.
In summary, the fine structure and complexity in multi-electron atoms illustrate the need for an advanced understanding of atomic interactions.
Historical Perspectives and Atomic Models
🔒 Unlock Audio Lesson
Sign up and enroll to listen to this audio lesson
Finally, let's discuss how historical atomic models are supported or challenged by spectroscopic evidence. Can someone give an example of how the Bohr model fits with hydrogen spectra?
Bohr’s model accurately predicts the wavelengths of hydrogen's spectral lines!
That's right! However, it fails with multi-electron atoms, as their spectra don’t align with Bohr's simplistic energy level predictions.
What about the fine structure?
Bohr's model struggles here as well; it doesn't account for the fine structure arising from electron interactions and relativistic effects. This highlights the need for advancements in quantum mechanics for accurate models.
To help us remember this history, think of 'MODEL'—Models Of Different Electron levels—showing how our understanding has evolved with spectroscopic evidence.
In summary, the evolution of atomic models reflects the insights gained from spectroscopy, revealing the nature of atomic structures while illustrating the limitations of earlier theories.
Introduction & Overview
Read summaries of the section's main ideas at different levels of detail.
Quick Overview
Standard
In this section, we explore the fundamental principles of emission and absorption spectra, detailing how transitions between quantized energy levels in atoms lead to discrete spectral lines. We delve into the spectral series for hydrogen and illustrate how spectroscopic observations can confirm or challenge atomic models.
Detailed
Spectroscopic Evidence for Atomic Models
Spectroscopy is the study of how electromagnetic radiation interacts with matter, particularly atoms and molecules. It serves as a key experimental basis for understanding atomic structure and has provided substantial evidence supporting the quantum mechanical model of the atom.
Key Areas Covered:
- Emission and Absorption Spectra: These spectra demonstrate that atoms emit or absorb light at specific wavelengths corresponding to energy transitions between quantized states. When an atom transitions from a higher energy state to a lower one, it emits a photon with energy equal to the difference in energy levels, leading to bright lines in the spectrum. Conversely, when atoms absorb photons, they transition to higher energy levels, leaving dark lines at specific wavelengths in an absorption spectrum.
- Hydrogen Line Spectra: The hydrogen atom, being the simplest with one electron, displays distinct spectral series, including the Lyman (ultraviolet), Balmer (visible), Paschen (infrared), among others. Each series corresponds to transitions from higher energy levels (n_i) to lower (n_f) and follows the Rydberg formula, revealing the quantized nature of atomic energy levels.
- Fine Structure and Line Broadening: This addresses the fine structure observed in spectral lines due to effects like electron spin and relativistic corrections. Fine structure splitting occurs when energy levels are slightly altered due to these interactions, helping refine our understanding of atomic behavior.
- Spectra of Multi-Electron Atoms: Multi-electron systems exhibit more complex spectra due to various interactions, including electron-electron repulsion and spin-orbit coupling, which lead to spectral line splitting.
- Historical Views on Atomic Models: Spectroscopic observations validate or refute historical atomic theories, most notably supporting Bohr's model for simpler atoms like hydrogen while revealing the limitations of the model in explaining spectra from multi-electron atoms.
Overall, spectroscopic analysis enhances our comprehension of atomic structure and the underlying principles governing electron transitions, solidifying the quantum mechanical framework while challenging classical perceptions.
Youtube Videos


Audio Book
Dive deep into the subject with an immersive audiobook experience.
Emission and Absorption Spectra: Basic Principles
Chapter 1 of 5
🔒 Unlock Audio Chapter
Sign up and enroll to access the full audio experience
Chapter Content
Discrete Spectral Lines: When atoms or ions transition between quantized energy levels, they absorb or emit photons whose energies correspond exactly to the difference between levels. As a result, we see discrete spectral lines rather than a continuous spectrum.
Detailed Explanation
In spectroscopy, both the emission and absorption spectra of an atom are based on the idea that electrons exist in quantized energy levels. When an electron jumps from a higher energy state to a lower one, it emits a photon (a particle of light) with an energy that corresponds to the difference in energy between the two levels. Conversely, when a lower-energy electron absorbs a photon of the right energy, it can jump to a higher energy level. This means that, when analyzing light emitted or absorbed by materials, they show specific wavelengths, resulting in spectral lines that are not continuous but appear as distinct lines or bands on a spectrum.
Examples & Analogies
Think of a light switch in a house. When the switch is off, the light is low. When you turn the switch on to a higher setting, the light becomes brighter. The switch position represents the energy states of electrons. Just like the light only works at specific settings, electrons can only exist in specific energy levels, and the on and off states lead to different visible conditions—that's similar to how we see discrete spectral lines.
Hydrogen Atom Spectral Series
Chapter 2 of 5
🔒 Unlock Audio Chapter
Sign up and enroll to access the full audio experience
Chapter Content
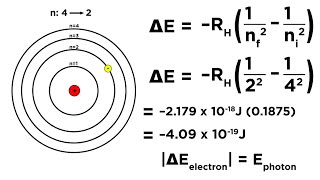
Hydrogen, being the simplest one-electron atom, provides a clear example of discrete line spectra. The formula for the wavenumber (which is 1 divided by wavelength) of any line in hydrogen’s spectrum can be written in plain words as: “The wavenumber equals the Rydberg constant for hydrogen, multiplied by [one divided by the square of the final energy level number minus one divided by the square of the initial energy level number].”
Detailed Explanation
In hydrogen's spectrum, we find specific patterns of lines called spectral series. The lines emerge due to transitions of its single electron between energy levels. The Rydberg formula helps to calculate these transitions, giving us the exact wavelengths of the emitted or absorbed light. This accuracy showcases the quantized nature of atomic energy levels, meaning that the energies can only be specific values and transitions occur between these definite levels, leading to distinct wavelengths of light.
Examples & Analogies
Imagine a staircase with distinct steps. You can only stand on one step at a time and can't float in between. In the same way, an electron in a hydrogen atom can only occupy certain energy levels (the steps) and moves between them by emitting or absorbing light when it transitions to a higher or lower energy level.
Named Spectral Series
Chapter 3 of 5
🔒 Unlock Audio Chapter
Sign up and enroll to access the full audio experience
Chapter Content
Depending on the value of the final energy level n_f, you get different series of lines:
1. Lyman Series (n_f = 1)
The Lyman series lies in the ultraviolet range.
-
Balmer Series (n_f = 2)
The Balmer series includes visible light lines. -
Paschen Series (n_f = 3)
The Paschen series lies in the infrared range.
Detailed Explanation
The named spectral series (Lyman, Balmer, Paschen) categorize the transitions of the hydrogen atom based on the final energy state the electron transitions to. For instance, the Lyman series corresponds to transitions ending at the first energy state and results in ultraviolet light emission. The Balmer series, on the other hand, ends at the second energy state and is visible to the human eye. Each series represents a different type of light that can be detected, corresponding to how the electron transitions between these specific energy levels.
Examples & Analogies
Consider the different colors of paint you can mix. Depending on the base colors (akin to initial energy states), you can create a variety of shades (or transitional states). Just like red or blue paints may represent specific colors, each spectral series represents certain wavelengths or types of light associated with the transitioning electron's energy levels.
Experimental Observation of Atomic Spectra
Chapter 4 of 5
🔒 Unlock Audio Chapter
Sign up and enroll to access the full audio experience
Chapter Content
Emission Spectroscopy: Discharge Lamps and Flame Tests
- Gas Discharge Tubes: A low-pressure gas is placed in a tube and energized, causing characteristic light emissions.
- Flame Tests: When heated, certain salts emit unique colors of light which can identify elements.
Detailed Explanation
In emission spectroscopy, scientists use gas discharge tubes filled with low-pressure gases. Applying voltage excites the gas atoms, causing them to emit light at specific wavelengths, resulting in identifiable spectral lines. Similarly, flame tests involve introducing a sample to flame, resulting in light emitted as electrons return to ground states from excited states, allowing for quick element identification based on observed colors. Both methods capitalize on the characteristic emission spectra of elements, linking light's properties to atomic structure.
Examples & Analogies
Think of a firework display where different compounds create various colors. When ignited, similar to how atoms are excited in discharge lamps, different elements create their own unique emissions—like how sodium produces bright yellow and copper gives blue/green colors. Just as you'd recognize a firework color as belonging to a specific type of firework, each element produces a unique spectral signature.
Zeeman and Stark Effects
Chapter 5 of 5
🔒 Unlock Audio Chapter
Sign up and enroll to access the full audio experience
Chapter Content
If atoms are placed in an external magnetic or electric field, their spectral lines split into multiple components. The splitting occurs due to interactions between the external fields and the energy levels of the electrons, altering how we perceive the spectral lines.
Detailed Explanation
The Zeeman Effect occurs when atomic spectral lines are observed in the presence of a magnetic field; the spectral lines split due to the interaction of the electron spins and orbital angular momentum with the magnetic field. Similarly, the Stark Effect is caused by an external electric field affecting the atomic energy levels, leading to shifts and splits in the observed lines. Both effects illustrate how external fields can alter the energy landscapes of atoms, leading to observable changes in spectra and providing insight into electron structure and behavior under varying conditions.
Examples & Analogies
Imagine hanging a picture on a wall. The picture’s initial position represents unperturbed energy levels. If you move the wall (like applying a magnetic field) or exert pressure on the picture (like an electric field), the picture shifts or warps relative to its original position. In a similar way, applying external fields alters the positions (energy levels) of the electron's spectral lines, causing them to shift or split, which can then be measured.
Key Concepts
-
Spectroscopy provides insights into atomic structure through emission and absorption phenomena.
-
Discrete spectral lines indicate quantized energy levels within an atom.
-
The Rydberg formula relates the spectral lines of hydrogen to its energy levels.
-
Fine structure and complexities arise in multi-electron atoms, illustrating limitations of simplified atomic models.
Examples & Applications
The bright lines seen in the emission spectrum of hydrogen correspond to specific electron transitions.
The dark lines in an absorption spectrum can be seen when white light passes through a hydrogen gas, indicating absorbed wavelengths.
Memory Aids
Interactive tools to help you remember key concepts
Rhymes
Spectra bright and spectra dark, show where the atoms have left their mark.
Stories
Once upon a time, in a magical light-filled kingdom, atoms danced and emitted colors, while the wise owl observed the disappearing shades of light, understanding that each dance step was an energy transition.
Memory Tools
Remember 'EARS'—Emission Absorbs Resulting Spectra to link how these processes reveal atomic structure.
Acronyms
LADA—Light Absorption, Dark Appearance for understanding absorption spectra.
Flash Cards
Glossary
- Spectroscopy
The study of the interaction between electromagnetic radiation and matter.
- Emission Spectrum
A spectrum that shows bright lines corresponding to the wavelengths of light emitted by excited atoms.
- Absorption Spectrum
A spectrum that shows dark lines where light has been absorbed by electrons transitioning to higher energy levels.
- Rydberg Formula
An equation that relates the wavelengths of spectral lines to the energy levels of an atom.
- Fine Structure
The small energy differences in atomic energy levels due to spin-orbit coupling and relativistic effects.
- MultiElectron Atoms
Atoms that contain more than one electron, resulting in complex interactions and energy levels.
- Quantum Mechanical Model
The modern understanding of atomic structure, which incorporates the principles of quantum mechanics.
Reference links
Supplementary resources to enhance your learning experience.