
Graphical Representation of Motion
Enroll to start learning
You’ve not yet enrolled in this course. Please enroll for free to listen to audio lessons, classroom podcasts and take practice test.
Interactive Audio Lesson
Listen to a student-teacher conversation explaining the topic in a relatable way.
Introduction to Distance-Time Graphs
🔒 Unlock Audio Lesson
Sign up and enroll to listen to this audio lesson

Today, we're going to learn about distance-time graphs. These graphs help us visualize how an object's position changes over time. Can anyone tell me what uniform motion means?

Uniform motion means the object moves at a constant speed.
Exactly! In a distance-time graph for uniform motion, we see a straight line. Can anyone explain why that line is straight?

Because the distance is increasing consistently over time.
Good job! Now, what do you think a non-uniform motion graph looks like?

It would be a curved line since the speed is changing.
Precisely! Remember, curves in a distance-time graph indicate variations in speed. Now, let's summarize: in uniform motion, we see straight lines, and in non-uniform, we observe curves.
Understanding Velocity-Time Graphs
🔒 Unlock Audio Lesson
Sign up and enroll to listen to this audio lesson

Now, let’s transition to velocity-time graphs. These graphs are vital for understanding acceleration. Who can explain what a straight line means in a velocity-time graph?

A straight line indicates uniform acceleration, right?
Correct! The slope of that line represents the object’s acceleration. Can someone tell me what the area under the velocity-time graph signifies?
It represents the distance traveled during that time!
Well done! So to summarize, in a velocity-time graph, a straight line shows constant acceleration, and the area under it gives you the distance covered.
Practical Application of Graphs in Motion
🔒 Unlock Audio Lesson
Sign up and enroll to listen to this audio lesson
Let’s apply what we've learned. Imagine a car traveling with uniform acceleration. If I provide you a velocity-time graph, can you find the distance traveled?
Yes! I would calculate the area under the graph to find that distance.
Exactly! And if the graph shows a curve, how would that change your approach?
I would need to break down the curve into shapes or use calculus to find the area.
Great thinking! This shows the necessity of these graphs in real-world applications. Always remember, graphs provide a clear picture of motion!
Introduction & Overview
Read summaries of the section's main ideas at different levels of detail.
Quick Overview
Standard
The section explains the importance of graphical representation in understanding motion. It discusses distance-time graphs for both uniform and non-uniform motion and velocity-time graphs indicating uniform acceleration, including the interpretation of slopes and areas under the graphs.
Detailed
Graphical Representation of Motion
In this section, we explore two significant types of graphs used in analyzing motion: distance-time graphs and velocity-time graphs. Understanding these graphs is crucial for accurately interpreting the behavior of moving objects.
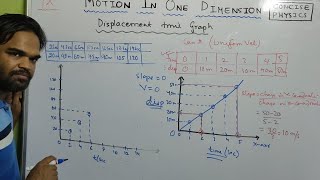
Distance-Time Graphs
- Uniform Motion: When an object moves at a constant speed, the distance-time graph is a straight line with a constant slope, indicating uniform motion.
- Non-Uniform Motion: For objects whose speeds change, the distance-time graph appears as a curved line, showcasing variations in speed over time.
Velocity-Time Graphs
- Uniform Acceleration: Here, the velocity-time graph features a straight sloping line, denoting constant acceleration. The slope of this line represents the acceleration of the object.
- Area Under the Graph: The area between the velocity-time graph and the time axis gives the total distance traveled during that period.
Understanding these graphical representations aids in visualizing motion patterns and analyzing the relationship between distance, time, velocity, and acceleration.
Youtube Videos


Audio Book
Dive deep into the subject with an immersive audiobook experience.
Distance-Time Graph
Chapter 1 of 2
🔒 Unlock Audio Chapter
Sign up and enroll to access the full audio experience
Chapter Content
- Distance-Time Graph
- Uniform motion: Straight line with constant slope
- Non-uniform motion: Curved line
Detailed Explanation
A Distance-Time Graph illustrates how the distance traveled by an object changes over time. In the case of uniform motion (constant speed), the graph will display a straight line. The slope of this line indicates the speed of the object, illustrating that distance increases consistently as time passes. Conversely, if the motion is non-uniform (variable speed), the graph shows a curved line, indicating that the object’s speed is changing throughout the time interval. Such a curve represents acceleration or deceleration in motion.
Examples & Analogies
Think of a car driving on a road. If the car maintains a constant speed (like driving at a steady pace of 60 km/h), the distance-time graph will be a straight line. If the car speeds up when exiting a freeway or slows down in traffic, the distance-time graph will appear as a curve, reflecting those changes in speed.
Velocity-Time Graph
Chapter 2 of 2
🔒 Unlock Audio Chapter
Sign up and enroll to access the full audio experience
Chapter Content
- Velocity-Time Graph
- Uniform acceleration: Straight sloping line
- Area under graph = distance travelled
- Slope = acceleration
Detailed Explanation
A Velocity-Time Graph displays how the velocity of an object changes over time. When an object undergoes uniform acceleration, the graph will show a straight line, either sloping upwards (indicating increasing velocity) or downwards (indicating decreasing velocity). The area under the line on this graph represents the total distance traveled during that time period. Additionally, the slope of the line indicates the object’s acceleration, allowing us to see how quickly its velocity is changing.
Examples & Analogies
Imagine an athlete running a race. If they start slowly and gradually increase their speed until they reach their top pace, the velocity-time graph would start at a low value and slope upwards. The area beneath this line would represent the total distance they run during the race. If they then slow down, the line would slope downwards, allowing us to visualize both their acceleration and deceleration.
Key Concepts
-
Distance-Time Graph: A graph that illustrates the distance traveled by an object over a period of time.
-
Velocity-Time Graph: A graph that shows how the velocity of an object changes over time.
-
Uniform Motion: A constant speed motion where the distance increases linearly on the graph.
-
Non-Uniform Motion: A variable speed motion represented as a curve on the graph.
-
Slope: Represents acceleration in a velocity-time graph.
-
Area under the graph: Represents distance traveled.
Examples & Applications
A distance-time graph shows an athlete running at a constant speed, forming a straight line.
A velocity-time graph of a car accelerating uniformly, displaying a linear increase in velocity.
Memory Aids
Interactive tools to help you remember key concepts
Rhymes
In distance-time, a straight line climbs, while curves show speed that changes over times.
Stories
Imagine a car driving evenly along a road; its distance-time graph is a straight line. Now think of the same car speeding up at a traffic light, creating a curve in its graph, showing its changing speed.
Memory Tools
D = Distance = 'Dancing on a straight line' for uniform motion; a curve represents changing speeds in non-uniform motion.
Acronyms
G.A.S. - Graphs Are Simple
Remember Distance-Time graphs are straight for constant speed and curved for variable speed.
Flash Cards
Glossary
- DistanceTime Graph
A graph that shows the relationship between distance traveled and time taken.
- VelocityTime Graph
A graph that represents the relationship between an object's velocity and the time taken.
- Slope
The steepness of a line on a graph, which represents the rate of change.
- Area Under the Graph
The space between the graph line and the axis, which can represent a physical quantity like distance.
- Uniform Motion
Motion at a constant speed in a straight line.
- NonUniform Motion
Motion at variable speeds.
- Uniform Acceleration
Constant acceleration over time.
Reference links
Supplementary resources to enhance your learning experience.