
Electrocardiograph (ECG)
Enroll to start learning
You’ve not yet enrolled in this course. Please enroll for free to listen to audio lessons, classroom podcasts and take practice test.
Interactive Audio Lesson
Listen to a student-teacher conversation explaining the topic in a relatable way.
Introduction to ECG
🔒 Unlock Audio Lesson
Sign up and enroll to listen to this audio lesson

Welcome, class! Today we are exploring the fascinating world of the Electrocardiograph, or ECG for short. Can anyone tell me what an ECG measures?

Is it about the heart’s electrical activity?
Exactly! The ECG captures the electrical signals produced by the heart during each cardiac cycle. By analyzing these signals, we can assess heart health.

How is an ECG set up?
Great question! Typically, three leads are placed on the body—one on each wrist and one on the left ankle to measure the heart's activity continuously. For more detailed evaluation, however, multiple leads may be used across the chest.

What do the different parts of the ECG mean?
Let's delve into that. Each segment of the ECG has a specific name and function. For instance, the P-wave represents atrial depolarization, leading to atrial contraction. Remember that with the mnemonic 'P for Pump - Atria First!'

And the QRS complex?
Great recall! The QRS complex stands for the depolarization of the ventricles. It represents the beginning of ventricular contraction. We can remember this with 'QRS - Quick Response Signal'.
To wrap up, what do we call the waveform that indicates the return of the ventricles to their normal state?
That would be the T-wave!
Perfect! Each heartbeat is represented on the ECG, allowing doctors to assess the heart's function.
Clinical Significance of ECG
🔒 Unlock Audio Lesson
Sign up and enroll to listen to this audio lesson

Now, let’s delve into why ECG is so clinically significant. Why do you think monitoring the heart's electrical activity is crucial?
It can tell us if someone has a heart problem, right?
Exactly! Changes in the typical ECG waveforms can indicate various heart conditions, such as arrhythmias or even heart attacks. If the waves deviate from expected shapes, it raises red flags for potential heart issues.
So, every ECG has a standard shape that we learn?
Yes! As health professionals, we learn to recognize these standard shapes. Deviations like an elongated QRS complex can suggest blockages. Remember the phrase 'Standard Shapes, Health Conditions!' to signify its importance?
What about heart rate?
Excellent point! By counting the number of QRS complexes over a set period, we can determine the heart rate, which is vital information in many clinical situations.
In summary, the ECG does not just monitor activity but serves as an essential diagnostic tool for assessing cardiovascular health and potential complications.
Introduction & Overview
Read summaries of the section's main ideas at different levels of detail.
Quick Overview
Standard
The ECG is a graphical representation of the heart's electrical activity, generated by placing electrodes on the body. It highlights electrical events leading to atrial and ventricular contractions, thus enabling the assessment of heart health and potential abnormalities.
Detailed
Detailed Summary
The Electrocardiograph (ECG) is essential for monitoring the heart's electrical activity throughout the cardiac cycle. To create a standard ECG, three leads are attached to a patient, usually at the wrists and left ankle, although additional leads may be used for a more detailed heart evaluation. The ECG consists of several waves each representing a significant event during the heart's electrical activity:
- P-wave: Represents atrial depolarization (excitation) leading to atrial contraction.
- QRS complex: Indicates ventricular depolarization starting shortly after the Q wave, which triggers ventricular contraction.
- T-wave: Signifies ventricular repolarization, marking the return of the ventricles to their resting state.
By counting the QRS complexes, health professionals can determine the heart rate, making the ECG crucial for diagnosing heart abnormalities. Deviations in expected waveforms can indicate possible heart-related diseases.
Youtube Videos


Audio Book
Dive deep into the subject with an immersive audiobook experience.
Understanding the ECG Machine
Chapter 1 of 4
🔒 Unlock Audio Chapter
Sign up and enroll to access the full audio experience
Chapter Content
You are probably familiar with this scene from a typical hospital television show: A patient is hooked up to a monitoring machine that shows voltage traces on a screen and makes the sound “... pip... pip... pip..... peeeeeeeeeeeeeeeeeeeeee” as the patient goes into cardiac arrest. This type of machine (electro-cardiograph) is used to obtain an electrocardiogram (ECG).
Detailed Explanation
The Electrocardiograph (ECG) is a medical machine that records the electrical activity of the heart. It's often depicted in TV shows as a crucial device for monitoring patients, especially during critical moments like cardiac arrest. The machine captures voltage fluctuations that occur with each heartbeat and translates them into visible tracings on a screen, along with audible alerts. This allows medical personnel to assess a patient’s heart health effectively.
Examples & Analogies
Think of the ECG as a heart's report card. Just like a student receives grades for their performance in school, the heart gets rated based on its electrical activity. When a student's performance drops, it raises a flag for teachers; similarly, if the ECG shows unexpected patterns, doctors can quickly investigate what's wrong.
How ECG Traces Work
Chapter 2 of 4
🔒 Unlock Audio Chapter
Sign up and enroll to access the full audio experience
Chapter Content
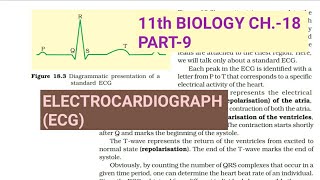
ECG is a graphical representation of the electrical activity of the heart during a cardiac cycle. To obtain a standard ECG (as shown in the Figure), a patient is connected to the machine with three electrical leads (one to each wrist and to the left ankle) that continuously monitor the heart activity. For a detailed evaluation of the heart’s function, multiple leads are attached to the chest region.
Detailed Explanation
An ECG captures the heart’s electrical activity throughout the cardiac cycle using leads (wires). In a standard configuration, three leads are connected to the patient's body: one on each wrist and one on the left ankle. This setup allows the machine to detect electrical impulses as they travel through the heart. For more comprehensive monitoring, additional leads can be attached to different positions on the chest. Each lead provides a different 'view' of the heart’s activity, enabling doctors to identify issues more accurately.
Examples & Analogies
Imagine trying to see a performance from different angles. Just like a movie might look different from the front, side, or back, the ECG leads help healthcare professionals view the heart's performance from various perspectives, ensuring they detect any anomalies effectively.
Interpreting ECG Waves
Chapter 3 of 4
🔒 Unlock Audio Chapter
Sign up and enroll to access the full audio experience
Chapter Content
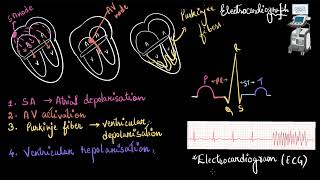
Each peak in the ECG is identified with a letter from P to T that corresponds to a specific electrical activity of the heart. The P-wave represents the electrical excitation (or depolarisation) of the atria, which leads to the contraction of both the atria. The QRS complex represents the depolarisation of the ventricles, which initiates the ventricular contraction. The contraction starts shortly after Q and marks the beginning of the systole. The T-wave represents the return of the ventricles from excited to normal state (repolarisation). The end of the T-wave marks the end of systole.
Detailed Explanation
The ECG consists of various waves - specifically P, QRS, and T - that denote different phases of cardiac electrical activity. The P-wave indicates that the atria are being stimulated, leading to their contraction. The QRS complex signals the ventricles' stimulation and subsequently their contraction. Lastly, the T-wave signifies the ventricles returning to a resting state. Understanding these waves helps doctors assess whether the heart is functioning properly or experiencing issues.
Examples & Analogies
Think of the ECG waves like the stages of a performance. The P-wave is like the opening act where the atria get ready, the QRS complex is the main performance when the ventricles are fully engaged, and the T-wave signifies the curtain call as the heart resets for the next cycle.
Significance of the ECG
Chapter 4 of 4
🔒 Unlock Audio Chapter
Sign up and enroll to access the full audio experience
Chapter Content
Obviously, by counting the number of QRS complexes that occur in a given time period, one can determine the heartbeat rate of an individual. Since the ECGs obtained from different individuals have roughly the same shape for a given lead configuration, any deviation from this shape indicates a possible abnormality or disease. Hence, it is of a great clinical significance.
Detailed Explanation
The ECG provides critical information about a person's heart health. By counting how many QRS complexes appear in a specific time frame, healthcare providers can quickly assess the heart rate. If someone's ECG deviates significantly in shape compared to standard patterns, this could indicate health issues such as arrhythmias (irregular heartbeats) or ischemia (lack of blood flow). Therefore, the ECG is pivotal for early detection of cardiac problems.
Examples & Analogies
Imagine an artist's signature that usually has a specific pattern. If someone's signature suddenly changes, it might raise concerns about their state of mind. Similarly, when the ECG pattern changes from what is expected, it serves as a red flag for doctors, prompting them to investigate further before serious complications arise.
Key Concepts
-
ECG: A tool to record the electrical activity of the heart.
-
P-wave: A representation of atrial depolarization.
-
QRS Complex: Comprises ventricular depolarization, initiating ventricular contraction.
-
T-wave: Indicates the return of ventricles to their normal state.
Examples & Applications
An ECG can reveal arrhythmias like atrial fibrillation when the heart beats irregularly.
During a heart attack, ST-segment elevation may be seen in the ECG, indicating a serious condition.
Memory Aids
Interactive tools to help you remember key concepts
Rhymes
P is for Push, the Atria’s call, QRS brings Ventricles for a big ball, T shows they take a break, that's the cycle’s thrall.
Stories
Imagine each wave as a character in a story: P is the energetic atrium, always primed to push and contract; QRS are the strong ventricles, ready to make a bold move; T is the resting hero, settling in after the action!
Memory Tools
Remember PQRST as 'Positive Energy Pulses, Quickly Responsible Signals, Time to Relax!' to visualize the ECG phases.
Acronyms
Use the acronym 'PAT-QRS-T' to remember the order of electrical events in the heart
P-wave
Atria contraction
T-wave
QRS complex.
Flash Cards
Glossary
- Electrocardiograph (ECG)
A medical instrument used to record the electrical activity of the heart over a period.
- Pwave
The wave in the ECG that indicates atrial depolarization.
- QRS Complex
The part of an ECG that represents ventricular depolarization.
- Twave
The wave in the ECG marking ventricular repolarization.
Reference links
Supplementary resources to enhance your learning experience.