
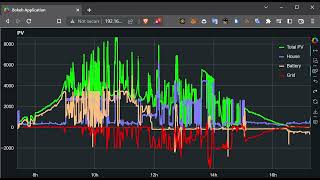
Interactive Time Series Plots
Enroll to start learning
You’ve not yet enrolled in this course. Please enroll for free to listen to audio lessons, classroom podcasts and take practice test.
Interactive Audio Lesson
Listen to a student-teacher conversation explaining the topic in a relatable way.
Introduction to Interactive Time Series Plots
🔒 Unlock Audio Lesson
Sign up and enroll to listen to this audio lesson

Today, we’ll delve into interactive time series plots. Can anyone tell me why interaction might be advantageous when visualizing time series data?

Maybe it helps to see changes over time more clearly?
Exactly! Interactive plots capture data more engagingly. They let us zoom, slide, and hover over points for detailed insights. This enhances our understanding of trends and cycles.

How do we create these plots? Are there specific tools for that?
Good question! We often use tools like Plotly and Bokeh for interactive visualizations. When we create a plot, we can specify features that enhance user interaction.
Tools and Features of Interactive Plots
🔒 Unlock Audio Lesson
Sign up and enroll to listen to this audio lesson

Let’s talk a bit more about the tools. Who has heard of Plotly?

I've seen it used in tutorials, but I’m not sure how it works.
Plotly is fantastic for creating complex interactive plots, including time series. Features like sliders and hover options allow us to manipulate the data visually.

What about Bokeh? Is it similar?
Bokeh is very powerful too, especially for larger datasets. It allows for web integration, making it easier to share visualizations.
Hands-on Example: Creating Interactive Plots
🔒 Unlock Audio Lesson
Sign up and enroll to listen to this audio lesson
Now, let's create an interactive time series plot. We’ll use a sample dataset to visualize trends over time. Who can explain what steps we might take?
First, we need to import the necessary libraries like Plotly or Bokeh, right?
Exactly! After that, we can load our data, specify the time series elements, and define our interactive features. Let's do this step by step.
Can we also add labels and modify colors?
Absolutely! Enhancing our plot with labels and maintaining a consistent color theme makes it clearer to interpret.
Introduction & Overview
Read summaries of the section's main ideas at different levels of detail.
Quick Overview
Standard
This section covers interactive time series plots, which utilize tools like Plotly and Bokeh to create engaging visual experiences. These visualizations offer features such as zooming, sliding, and hover effects, making it easier to explore complex datasets over time.
Detailed
Interactive Time Series Plots
In this section, we focus on the importance of interactive time series plots within the realm of data visualization. These plots are created using tools like Plotly, Bokeh, and Dash, which allow for dynamic interaction with the data. The primary advantages of interactive plots include the ability to zoom in on specific areas of interest, slide through time to get more detailed views of data points, and hover over plot elements to display additional information such as data values and dates. These features streamline the analysis process, enabling users to explore trends and patterns in time series data more effectively.
Youtube Videos

Audio Book
Dive deep into the subject with an immersive audiobook experience.
Overview of Interactive Time Series Plots
Chapter 1 of 2
🔒 Unlock Audio Chapter
Sign up and enroll to access the full audio experience
Chapter Content
• Tools: Plotly, Bokeh, Dash
Detailed Explanation
This chunk introduces the tools used for creating interactive time series plots. Interactive plots allow users to engage with the data in real time, providing a better understanding of the trends. Plotly, Bokeh, and Dash are popular tools for building these interactive visualizations. Each of these tools has unique features that cater to different needs in data visualization.
Examples & Analogies
Think of interactive time series plots as a roadmap. Just like a map allows you to zoom in on a specific area or drag the view to see a different part of the landscape, these plots let you explore data, uncovering trends and patterns that you might miss in static visualizations.
Features of Interactive Plots
Chapter 2 of 2
🔒 Unlock Audio Chapter
Sign up and enroll to access the full audio experience
Chapter Content
• Add zoom, slider, hover options for exploration.
Detailed Explanation
Interactive time series plots can include various features that enhance user experience. For example, users can zoom in to focus on a specific time frame, use sliders to navigate through the data over time, and hover over points to see detailed information about those data points. These features make it easier to explore the data thoroughly and to uncover insights that are not immediately apparent.
Examples & Analogies
Imagine attending a concert where you can control the lights and sounds at different points in the show. This interaction allows you to tailor your experience and focus on what aspects you find most enjoyable. Similarly, interactive time series plots give you control over how you view and interpret the data.
Key Concepts
-
Interactive Time Series Plots: Visualizations that allow dynamic engagement with time series data through tools like Plotly and Bokeh.
-
Plotly: A widely-used library for creating interactive plots that enhance data visualization experiences.
-
Bokeh: Another powerful tool for crafting interactive visualizations, especially suitable for larger data sets.
Examples & Applications
Using Plotly to create an interactive stock price time series plot that allows users to zoom and pan.
Using Bokeh to visualize temperature changes over a year with sliders to adjust date ranges.
Memory Aids
Interactive tools to help you remember key concepts
Rhymes
To see the trends and find the clues, use interactive plots; they're the best of the views!
Stories
Imagine a virtual garden where each flower represents data; as you move closer, you can see intricate details bloom.
Memory Tools
Remember 'PLOT' for interactive tools: P for Plotly, L for Large datasets, O for Online access, T for Time series!
Acronyms
I.P.
Interactive Plots for Engagement and Exploration!
Flash Cards
Glossary
- Interactive Plot
A type of visualization that allows users to engage dynamically with the data, often featuring zooming and hover capabilities.
- Plotly
A graphing library for Python that enables the creation of interactive plots for data analysis.
- Bokeh
A Python interactive visualization library that targets web browsers for interactive visualizations.
Reference links
Supplementary resources to enhance your learning experience.