
Seasonal Decomposition Plots
Enroll to start learning
You’ve not yet enrolled in this course. Please enroll for free to listen to audio lessons, classroom podcasts and take practice test.
Interactive Audio Lesson
Listen to a student-teacher conversation explaining the topic in a relatable way.
Understanding Seasonal Decomposition
🔒 Unlock Audio Lesson
Sign up and enroll to listen to this audio lesson

Today we're going to explore seasonal decomposition plots. Who here can tell me why understanding the components of a time series is important?

I think it helps in figuring out patterns in the data.
Exactly! Decomposing a time series allows us to separate the trend, seasonality, and residuals. Understanding these components helps in forecasting and analyzing data. Can anyone tell me what trend refers to?

The general direction in which data moves over time?
Correct! And seasonality refers to...?

Repetitive patterns that occur at regular intervals!
Right! Before we move on to the coding part for these plots, let's all remember the acronym 'TSR': Trend, Seasonality, Residuals. This will help you recall the key components. Now, how do you think identifying these will be useful?

It helps in better decision-making and understanding the underlying data!
Precisely! Let’s dive into how to implement these concepts using Python.
Implementing Seasonal Decomposition
🔒 Unlock Audio Lesson
Sign up and enroll to listen to this audio lesson

Now that we've understood the importance, let’s look at how to implement seasonal decomposition in Python. The function `seasonal_decompose()` from the `statsmodels` library is what we use. Can anyone share how to set it up?
We need to import `seasonal_decompose` from `statsmodels.tsa.seasonal` and call it on our time series data?
Exactly! Here’s a code snippet: `result = seasonal_decompose(time_series, model='additive')`. This will allow us to see the additive components. What do we do next?
We can plot the results using `result.plot()` to visualize the components!
Absolutely! Visualizing helps us understand the data better. Let's recall the three components: trend, seasonality, and residuals. If we notice any irregular spikes in residuals, what might that indicate?
Those could be outliers or anomalies.
Great observation! Always keep an eye on those residuals for unexpected behavior.
Interpreting Seasonal Decomposition Results
🔒 Unlock Audio Lesson
Sign up and enroll to listen to this audio lesson
Let’s move forward to interpreting our decomposition plot. Once you have the plots, what should be our first step?
Look at the trend to see if it is increasing or decreasing over time?
Exactly! We also need to consider the seasonal component. How would we analyze that?
Check for regular patterns at specific intervals, like peaks or troughs.
Right. Patterns repeating at regular intervals indicate strong seasonality. What about the residual component?
It's like the noise in the data and shows anything unexpected!
Fantastic! Remember, clean analysis helps us discern actionable insights from the chaos of data.
Introduction & Overview
Read summaries of the section's main ideas at different levels of detail.
Quick Overview
Standard
This section discusses seasonal decomposition plots, which are essential for breaking down time series data into understandable components, including the underlying trend, seasonal patterns, and any residual fluctuations. With the usage of code examples, the section illustrates how to implement these plots using Python's statsmodels library.
Detailed
Detailed Summary of Seasonal Decomposition Plots
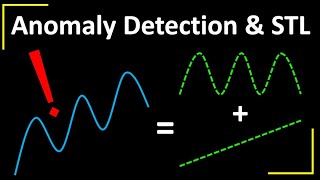
Seasonal decomposition plots play a crucial role in the analysis and interpretation of time series data. They enable data scientists and analysts to decompose a given time series into three distinct components:
1. Trend
- The overarching direction of the data over a specified period. It highlights the long-term behavior of the series.
2. Seasonality
- The repetitive pattern present in the data that occurs at regular intervals due to seasonal factors. This could be daily, weekly, monthly, or yearly.
3. Residuals
- The noise remaining after the trends and seasonal components have been accounted for. Residuals can contain valuable information regarding anomalies and unexpected fluctuations in the data.
Using the seasonal_decompose() function from the statsmodels library, we can effectively illustrate these components through visual plots. The provided code snippet allows users to apply the decomposition process to any time series data whereby the additive or multiplicative model can be specified, depending on the nature of the data. Understanding these components is essential, as it lays the groundwork for more advanced forecasting methods and data insights.
Youtube Videos

Audio Book
Dive deep into the subject with an immersive audiobook experience.
Introduction to Seasonal Decomposition Plots
Chapter 1 of 2
🔒 Unlock Audio Chapter
Sign up and enroll to access the full audio experience
Chapter Content
• Used to separate trend, seasonality, and residuals.
Detailed Explanation
Seasonal decomposition plots are visual tools used in time series analysis to break down a dataset into three main components: the trend, seasonality, and residuals. The trend indicates the long-term increase or decrease in the data, seasonality shows repeating fluctuations over specific periods, and residuals represent the random noise or variability in the data that cannot be attributed to trend or seasonality. By separating these elements, analysts can understand their data's underlying patterns more clearly.
Examples & Analogies
Imagine you are tracking the growth of a plant over the seasons. The trend shows how the plant grows over multiple years, indicating overall health and growth patterns. Seasonality reveals how the plant's growth fluctuates with changing seasons (like growing faster in spring and slower in winter). The residuals are the unexpected changes, like a sudden drop in temperature affecting growth. By using seasonal decomposition, you can better analyze and understand how each of these factors affects the plant's growth.
Implementation of Seasonal Decomposition in Python
Chapter 2 of 2
🔒 Unlock Audio Chapter
Sign up and enroll to access the full audio experience
Chapter Content
from statsmodels.tsa.seasonal import seasonal_decompose
result = seasonal_decompose(time_series, model='additive')
result.plot()
Detailed Explanation
In this chunk, we provide the Python code necessary to perform seasonal decomposition using the Statsmodels library. The function seasonal_decompose takes a time series dataset as input and applies an additive model to separate the components. The output result then includes the trend, seasonality, and residual components, which are visualized with the plot method. This step demonstrates how straightforward it is to implement seasonal decomposition in a programming environment, making the analysis accessible to data scientists.
Examples & Analogies
Consider conducting a weather analysis project. You have monthly temperature data for several years. By implementing this code, you can visually assess how temperatures change over time. The trend indicates the gradual warming observed in recent years, seasonality shows annual fluctuations (like summer and winter variations), and the residuals might capture unusual weather patterns (like extreme weather events). This helps you and others appreciate not just averages, but the dynamics of weather changes.
Key Concepts
-
Seasonal Decomposition: Process of splitting a time series into its fundamental components: trend, seasonality, and residuals.
-
Trend: The general upward or downward direction over time.
-
Seasonality: Regular patterns occurring in time series data at specific intervals.
-
Residuals: The components of the time series that cannot be explained by the trend or seasonality.
Examples & Applications
For a retail sales dataset, seasonal decomposition can reveal average sales trends over the years, seasonal spikes during holidays, and any unusual sales patterns as residuals.
In a weather dataset, decomposing temperature data could show overall warming trends, seasonal variations with summer and winter patterns, and anomalies such as unexpected cold snaps.
Memory Aids
Interactive tools to help you remember key concepts
Rhymes
When you decompose, don't forget: Trend, Seasonality, and Residual set!
Stories
Imagine a gardener reviewing the yearly cycles of plants, identifying growth trends, seasonal blooms, and unexpected weeds growing at unusual times - so goes the story of seasonal decomposition!
Memory Tools
To remember the components, think 'TSR' for Trend, Seasonality, and Residuals.
Acronyms
T.S.R. - Tells us the Trend, Shows us Seasonality, and Reveals the Residuals.
Flash Cards
Glossary
- Seasonal Decomposition
A method to separate a time series into its trend, seasonality, and residual components.
- Trend
The long-term progression of the series level, indicating the direction (increase or decrease).
- Seasonality
The repeating patterns or cycles in a time series that occur at regular intervals.
- Residuals
The remaining value after the trend and seasonal patterns have been removed, essentially the noise in the data.
Reference links
Supplementary resources to enhance your learning experience.