
Graphical Representation of Harmonic Response
Enroll to start learning
You’ve not yet enrolled in this course. Please enroll for free to listen to audio lessons, classroom podcasts and take practice test.
Interactive Audio Lesson
Listen to a student-teacher conversation explaining the topic in a relatable way.
Introduction to Graphical Representation
🔒 Unlock Audio Lesson
Sign up and enroll to listen to this audio lesson

Today, we're focusing on how we can visually represent the harmonic response of systems. Can anyone tell me why graphical representation is important?

I think it helps us see how systems respond in real-time.

And it could help in identifying points where things might go wrong, like resonance.
Exactly! Graphs allow us to visualize response and phase shifts, especially noticeable when operating near a system's natural frequency. Now, let's discuss the first graph, the Response vs Frequency Ratio.
Response vs Frequency Ratio
🔒 Unlock Audio Lesson
Sign up and enroll to listen to this audio lesson

The Response vs Frequency Ratio graph shows sharp peaks at resonance. What does this tell us about the system?

It means that the system's response can become very large at certain frequencies.

So if we're not careful, we can end up with too much movement or even failure?
Exactly! This is called dynamic amplification. It's crucial for engineers to predict and mitigate this behavior. Knowing the frequency where this peak occurs allows us to design better systems.
Phase vs Frequency Ratio
🔒 Unlock Audio Lesson
Sign up and enroll to listen to this audio lesson
Next, let's examine the Phase vs Frequency Ratio graph. Why do you think understanding phase shifts is essential?
I guess it affects how well dampers work, right?
Yes! If the phase shift is off, we might not be able to isolate vibrations effectively.
That's right! Knowing how phase changes from 0° to 180° helps in tuning absorbers. Engineers can ensure the system efficiently responds to external forces without amplifying them.
Applications of Graphical Representations
🔒 Unlock Audio Lesson
Sign up and enroll to listen to this audio lesson
How do you think these graphs relate to practical engineering design?
They could help us visualize how buildings or machines would react during an earthquake or when machinery is running.
And adjusting damper settings for buildings could be based on what these graphs tell us.
Absolutely! Utilizing these graphs effectively can be the difference between a structure that withstands forces and one that fails during dynamic events.
Introduction & Overview
Read summaries of the section's main ideas at different levels of detail.
Quick Overview
Standard
In this section, we explore the graphical representation of harmonic responses, focusing on the response versus frequency ratio and phase versus frequency ratio. These graphical tools are essential for analyzing system behavior across varying conditions, such as determining resonance and tuning dynamic absorbers.
Detailed
Graphical Representation of Harmonic Response
In this section, we delve into the graphical representation of the harmonic response of structures subjected to harmonic excitation. Two key visualizations are emphasized:
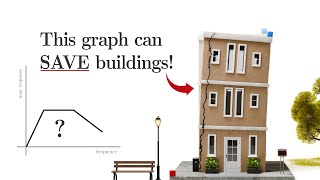
Response vs Frequency Ratio
- This graph typically displays sharp peaks at resonance when damping is light, indicating that the system's amplitude increases substantially as it approaches its natural frequency. This characteristic is pivotal for understanding how systems behave under varying operating conditions and can lead to dynamic overshoots if not properly managed.
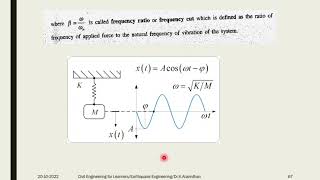
Phase vs Frequency Ratio
- Here, the transition from 0° to 180° illustrates how the phase angle between the input (harmonic excitation) and the output (system response) changes with frequency. This information is vital for tuning dynamic absorbers and isolators, ensuring that the system does not inadvertently amplify part of the harmonic input that it is meant to mitigate.
Together, these graphical representations provide insight into the stability and performance of structures under dynamic loads, guiding engineers in designing safer and more effective systems.
Youtube Videos


Audio Book
Dive deep into the subject with an immersive audiobook experience.
Response vs Frequency Ratio
Chapter 1 of 2
🔒 Unlock Audio Chapter
Sign up and enroll to access the full audio experience
Chapter Content
Shows sharp peaks at resonance (light damping).
Helps understand behavior across different operating conditions.
Detailed Explanation
The response versus frequency ratio graph is important in understanding how a system behaves when subjected to varying frequencies of excitation. At the resonance frequency, which is when the frequency of the external force matches the natural frequency of the system, the response peak becomes very sharp, especially for lightly damped systems. This indicates a significant increase in amplitude, leading to potential structural issues if not managed properly. This visualization helps engineers predict how the system will behave under different loading conditions, ensuring safer and more resilient designs.
Examples & Analogies
Imagine a swing at a playground. If someone pushes the swing at just the right moment (the swing's natural frequency), it goes much higher. However, if they push too fast or too slow, the swing doesn’t go very high. Similarly, in civil engineering, knowing this behavior helps engineers design structures that can withstand forces like earthquakes.
Phase vs Frequency Ratio
Chapter 2 of 2
🔒 Unlock Audio Chapter
Sign up and enroll to access the full audio experience
Chapter Content
Smooth transition from 0° to 180°.
Important for tuning dynamic absorbers and isolators.
Detailed Explanation
The phase versus frequency ratio graph illustrates how the phase angle of a system's response changes with frequency. The phase angle shows the time delay between the applied force and the system's reaction. In this case, as the frequency increases, the phase angle changes smoothly from 0° to 180°. Understanding this relationship is crucial in designing dynamic absorbers for structures; when engineers know how much the system will lag due to damping, they can better adjust the absorbers to minimize vibrations.
Examples & Analogies
Think of singing in a group where everyone needs to harmonize. If one person sings slightly off-beat (like a delayed phase), the sound becomes dissonant. Tuning ensures that all voices align properly, much like phase tuning helps to ensure structures respond harmoniously to forces, minimizing potential issues.
Key Concepts
-
Response vs Frequency Ratio: Illustrates the peaks in system amplitude at resonance.
-
Phase vs Frequency Ratio: Shows how the phase shift between input and output changes with frequency.
-
Damping: Reduces the amplitude peaks and stabilizes the response.
-
Tuning Absorbers: Phase data is crucial for ensuring that devices effectively mitigate vibrations.
Examples & Applications
The response graph for a building under seismic loads shows how its amplitude spikes near resonant frequencies, indicating potential for structural failure if not addressed.
In machinery, analyzing the phase shift allows engineers to design better damping systems, ensuring that vibrations from equipment do not disrupt operations.
Memory Aids
Interactive tools to help you remember key concepts
Rhymes
When the frequency's in tune, you may face doom; response peaks too high, like a bridge in the sky.
Stories
Imagine a tightrope walker feeling the sway of the rope underfoot. As they approach the center, the tension builds, illustrating resonance. If they balance at just the right frequency, they stay upright; otherwise, they risk falling, reflecting how understanding these graphical responses is critical in engineering.
Memory Tools
RAP (Response Amplitude Peak) - remember that response peaks sharply at resonance!
Acronyms
RFP (Response Frequency Phase) - helps remember that we assess both response and phase in design.
Flash Cards
Glossary
- Frequency Ratio
The ratio of the excitation frequency to the natural frequency of the system, indicating how close the system is to resonance.
- Resonance
The phenomenon where a system amplifies its response when the excitation frequency matches its natural frequency.
- Phase Shift
The lag or lead of the output signal relative to the input signal, usually expressed in degrees.
Reference links
Supplementary resources to enhance your learning experience.