
Calibration and Quantification
Enroll to start learning
You’ve not yet enrolled in this course. Please enroll for free to listen to audio lessons, classroom podcasts and take practice test.
Interactive Audio Lesson
Listen to a student-teacher conversation explaining the topic in a relatable way.
Introduction to Calibration
🔒 Unlock Audio Lesson
Sign up and enroll to listen to this audio lesson

Today, we are going to discuss calibration in gas chromatography. Calibration helps relate the concentration of an analyte to the response from the detector.

Why is calibration so important, Teacher?
Great question! Calibration ensures the accuracy of our measurements. It lets us convert detector signals into meaningful concentrations.

How do we perform calibration?
We usually inject known concentrations of a standard analyte, measure the response, and then plot these values to create a calibration curve.

What does the calibration curve look like?
It’s typically a straight line in a plot of detector response against concentration. This graphical representation is crucial for determining the concentration of unknown samples.
In summary, calibration is essential in ensuring reliable results in gas chromatography.
Understanding Detector Response
🔒 Unlock Audio Lesson
Sign up and enroll to listen to this audio lesson

Detectors are the heart of the gas chromatography system when it comes to measuring the components of a sample. Can anyone tell me the types of detectors we might use?

I think FID and ECD are two common types?
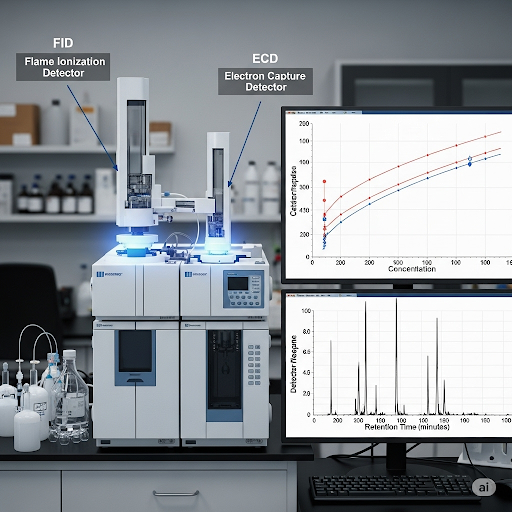
Correct! The Flame Ionization Detector (FID) is excellent for hydrocarbons, whereas the Electron Capture Detector (ECD) is very sensitive to halogenated compounds. Their responses help us create calibration curves.
What do we mean by 'detector response'?
The detector response measures the intensity of the signal generated by the detector when an analyte passes through it. We can quantify this response to determine concentration.
To summarize this concept, the quality of our quantification relies greatly on the sensitivity and specificity of our chosen detector.
Challenges in Quantification
🔒 Unlock Audio Lesson
Sign up and enroll to listen to this audio lesson
Now, let’s talk about some challenges we face in quantification. What could they be?
Maybe interference from other compounds?
Exactly! Co-elution of analytes can occur when similar compounds come out of the column at very similar times, leading to inaccuracies.
How do we overcome that?
We can address this issue by using standards to verify our peaks against known retention times and adjusting our chromatography parameters.
What if we still can’t separate them well?
In those cases, it may require new methods, such as altering the chromatographic conditions like temperature or stationary phase. So, effective calibration and differentiation are key!
In conclusion, challenges in quantification can often be managed with thorough preparation and understanding of our system's workings.
Retention Time and Its Importance
🔒 Unlock Audio Lesson
Sign up and enroll to listen to this audio lesson
Retention time is a pivotal factor we should focus on next. Can someone tell me what retention time means?
Is it the time it takes for the analyte to travel through the column?
Right! Each analyte has a characteristic retention time under specific conditions, which is crucial for identifying substances in a mixture.
Does it change with different conditions?
Absolutely! Changes in temperature or the stationary phase can alter the retention time, so it’s essential to keep those consistent.
How do we use it in calibration?
We utilize retention time to validate our results against standards, ensuring we interpret peaks correctly during quantitative analysis.
In summary, understanding retention time helps us effectively identify compounds during chromatographic analysis and ensure accurate calibration.
Introduction & Overview
Read summaries of the section's main ideas at different levels of detail.
Quick Overview
Standard
The section delves into calibration techniques in gas chromatography, emphasizing the need for accurate measurement of analytes through established response functions. It highlights key factors affecting the calibration process, including the significance of retention time and the role of specific detectors, like FID and ECD, to achieve reliable quantification.
Detailed
Calibration and Quantification in Gas Chromatography
Calibration in gas chromatography is a crucial process that connects the amount of analyte with the corresponding detector response. The primary goal is to create a reliable calibration curve, which plots known concentrations against measured responses in order to quantify unknown samples accurately.
Key Points Covered:
- Detector Response: The calibration process relies on instruments like Flame Ionization Detectors (FID) and Electron Capture Detectors (ECD) which provide signals that need to be quantified.
- Retention Time: Retention time is unique for each analyte under specific conditions, and this information is vital for both identification and quantification. Each compound emerges from the column at a characteristic time, which must remain consistent across analyses for reliable results.
- Calibration Curve: A calibration curve is generated by injecting known concentrations of an analyte into the GC system, recording the responses as signals, and plotting these against concentrations.
- Standard Practices: Regular standards must be injected to ensure the calibration remains valid over time, as changes in instrumental settings or conditions can affect the detector's response.
- Quantification Challenges: The section details the challenges in calibration, specifically the need for the right standards and the limitations of non-selective detectors.
This meticulous method ensures that the quantification of analytes in complex mixtures is both accurate and reliable, which is essential for practical applications in environmental monitoring, pharmaceuticals, and other fields.
Youtube Videos


Audio Book
Dive deep into the subject with an immersive audiobook experience.
Introduction to Calibration
Chapter 1 of 5
🔒 Unlock Audio Chapter
Sign up and enroll to access the full audio experience
Chapter Content
In gas chromatography, calibration is a chart between concentration or mass and some response. Calibration needs to be done very specifically for one compound, which means I need to know what the compound is and if there are different analytes.
Detailed Explanation
Calibration is a crucial process in gas chromatography that helps establish a relationship between the concentration of a substance and the resulting detector response. The calibration chart allows scientists to determine how much of a substance is present in a sample based on the signals they receive from the detector. It's important for each specific compound since different compounds can produce varying responses even at the same concentration.
Examples & Analogies
Think of calibration like following a recipe. If you're baking a cake, each ingredient needs to be measured accurately to achieve the desired flavor and texture. Just like measuring flour, sugar, and eggs, you must accurately determine the concentration of the substance you are analyzing to get reliable results.
How to Perform Calibration
Chapter 2 of 5
🔒 Unlock Audio Chapter
Sign up and enroll to access the full audio experience
Chapter Content
To get calibration information, I inject a known amount of an analyte into the GC. I record the response (let's call it M1 or concentration 1). This response is typically the area under the peak corresponding to this compound.
Detailed Explanation
The calibration process starts by injecting a known quantity of a compound, known as the analyte, into the gas chromatograph. The detector measures the signal produced, which is represented as a peak on a chromatogram. The area of this peak correlates to the amount of substance injected, thus giving a first data point for the calibration curve.
Examples & Analogies
Imagine you are measuring how much lemonade you get from different amounts of lemon juice. If you know that 100 grams of lemon juice produces a certain amount of lemonade, you can use this information (the response) to predict how much lemonade you'll get from other amounts of juice. The peak area in chromatography works in a similar way—it helps estimate how much analyte is in a mixture based on previously known values.
Retention Time and Its Importance
Chapter 3 of 5
🔒 Unlock Audio Chapter
Sign up and enroll to access the full audio experience
Chapter Content
The retention time is the time at which a particular compound comes out. It's a key characteristic of an analyte for a given system and will change if temperature, mobile phase properties, or column type change.
Detailed Explanation
Retention time refers to the duration a compound spends in the chromatographic column before it is detected. Each compound typically has a unique retention time under specific conditions (like temperature or mobile phase). Understanding retention time is crucial because it helps identify compounds in a mixture; consistent retention times indicate consistent behaviors of specific compounds.
Examples & Analogies
Consider waiting for a friend at a train station. Each friend takes a different train that arrives at different times. Once you know when each train typically arrives, you can predict when your friend will show up. In chromatography, knowing the retention time for specific compounds allows scientists to identify them in mixtures, just as knowing train schedules helps you anticipate your friend's arrival.
Analyzing Mixtures with Standards
Chapter 4 of 5
🔒 Unlock Audio Chapter
Sign up and enroll to access the full audio experience
Chapter Content
To identify compounds in a sample, the basis is retention time. You can inject standards for the compounds to verify their identities based on these retention times.
Detailed Explanation
To confirm which compounds are present in a sample, analysts often run standard tests. By injecting a known standard of a compound that should be in the sample, they can compare its retention time with peaks in the sample's chromatogram. If the retention times match, they can be confident about the presence of that compound.
Examples & Analogies
It's like identifying a song you hear on the radio. If you hear a familiar tune and know the song well (your standard), you can confidently say that's what the DJ is playing. In the same way, if a known compound arrives at the same retention time as a peak in the sample, you can identify it with high confidence.
Challenges in Calibration and Identification
Chapter 5 of 5
🔒 Unlock Audio Chapter
Sign up and enroll to access the full audio experience
Chapter Content
Retention time alone cannot guarantee identification. Compounds may have similar retention times, requiring careful verification through standards and possibly spiking the sample.
Detailed Explanation
Even if two compounds arrive at the same retention time, they might not be the same. This overlap requires further validation. To enhance confidence in their identifications, analysts can 'spike' a sample, a process where a known amount of the suspected compound is added. A subsequent increase in the peak area of that compound's signal confirms its presence.
Examples & Analogies
Think of it like trying to identify people in a group based solely on their hair color and height. It can lead to confusion if two people look similar. To clarify, you might ask each person to wear a name tag (the spiking process) to confirm their identities. In chromatography, spiking serves a similar purpose, helping to ensure that the detected peak truly corresponds to the expected compound.
Key Concepts
-
Calibration: The process of establishing the relationship between concentration and detector response.
-
Retention Time: A key factor in identifying and quantifying analytes.
-
Detector Response: The electrical measure that informs about the presence and amount of an analyte.
-
Calibration Curve: A graphical representation essential for quantifying unknown samples based on known standards.
Examples & Applications
For example, if injecting a known concentration of a hydrocarbon results in a peak area of '50 units', this area can then be plotted on a calibration curve.
If a sample shows a peak at a similar retention time as a standard but a lower area, it indicates a lower concentration of that specific analyte in the sample.
Memory Aids
Interactive tools to help you remember key concepts
Rhymes
For calibration, do not stray, accuracy will save the day!
Stories
Imagine you’re a detective needing to find a hidden treasure (analyte) in a maze (column); each turn you take (retention) brings you closer to knowing its specific location (identification).
Memory Tools
Remember CRD: Calibration, Retention, Detector response.
Acronyms
Use 'CANDY' - Calibration, Analyte, Neatness in Data, Yield results.
Flash Cards
Glossary
- Calibration
The process of determining the relationship between the quantity of analyte and the response of the detector.
- Retention Time
The time taken for a particular analyte to travel through the chromatography column and reach the detector.
- Detector Response
The signal generated by the detector when an analyte passes through, which is used to quantify concentration.
- Calibration Curve
A graph plotting known concentrations of an analyte against measured detector responses to quantify unknown samples.
- Flame Ionization Detector (FID)
A type of detector used in gas chromatography that measures hydrocarbons based on the ions generated by combustion.
- Electron Capture Detector (ECD)
A highly sensitive detector used in gas chromatography that is particularly effective for detecting halogeneated compounds.
Reference links
Supplementary resources to enhance your learning experience.