
Quality Control Measures
Enroll to start learning
You’ve not yet enrolled in this course. Please enroll for free to listen to audio lessons, classroom podcasts and take practice test.
Interactive Audio Lesson
Listen to a student-teacher conversation explaining the topic in a relatable way.
Introduction to Analyte Losses
🔒 Unlock Audio Lesson
Sign up and enroll to listen to this audio lesson

Good morning, class! Today, we’ll talk about analyte losses in environmental analysis. Analyte losses can occur during sampling, transport, and processing. Why do you think it's important to minimize these losses?

I think it's important because if we lose part of the analyte, our measurements might be inaccurate!

Yes, and that could lead to wrong decisions being made, especially if the results are for pollution levels.
Exactly! That's why understanding the types of losses—volatilization, reaction, and adsorption—is crucial. Can anyone explain what volatilization means?

It’s the evaporation of analytes, right? Like if you leave a sample open to the air.
Perfect! Always remember: when we want to avoid volatilization, we should aim for airtight containers. Let’s summarize: what are the three types of analyte losses?

Volatilization, reaction, and adsorption!
Methods to Control Analyte Loss
🔒 Unlock Audio Lesson
Sign up and enroll to listen to this audio lesson

Now let’s dive into methods for controlling analyte losses. Can anyone describe what a Laboratory Control Sample is?
It’s when you add a known amount of a standard to the sample to check recovery rates.
Exactly! This helps us understand how much analyte we might be losing. What about a matrix spike?
That’s where you take two subsamples, one with an added standard and one without, to check for differences.
Very good! It’s an effective way to gauge matrix effects. How about blank analysis? What role does it play?
It helps identify contamination in the analysis setup. If the blank shows any value, we have a problem!
Nailed it! Remember to always check your blanks before proceeding with actual sample analysis.
Measuring Recovery Efficiency
🔒 Unlock Audio Lesson
Sign up and enroll to listen to this audio lesson
Let's discuss recovery efficiency. Why do we measure it in environmental analysis?
To understand how much of the analyte we can actually accurately measure, right?
And to make sure that underestimating pollutant concentrations doesn't happen!
Exactly! If we don’t estimate recovery, we could significantly underreport pollutants. Can anyone tell me how we calculate recovery efficiency?
By comparing the measured concentration to the true concentration.
Great! The formula is �% Recovery = (Measured Concentration / True Concentration) x 100. Now let’s recap: why is recovery efficiency important?
To avoid underestimating the real concentration of pollutants in the samples!
Identifying False Positives and Negatives
🔒 Unlock Audio Lesson
Sign up and enroll to listen to this audio lesson
In this session, we need to discuss false positives and negatives. Can someone explain the difference?
A false positive indicates an analyte is present when it's not, while a false negative is where we miss detecting an analyte that is present.
Exactly! Contamination due to dirty apparatus can cause false positives. How do we mitigate this risk?
By regularly cleaning and checking our analysis equipment!
Correct! Another method is using blanks to determine if there's contamination in your system. Let’s summarize—what are a few preventive measures against false results?
Regular cleaning, using blanks, and ensuring proper sampling techniques!
Introduction & Overview
Read summaries of the section's main ideas at different levels of detail.
Quick Overview
Standard
The section outlines the procedures to minimize analyte losses through transport, storage, and processing in environmental sampling. It emphasizes various types of sample losses, including volatilization, reaction, and adsorption, and introduces methods to estimate and recover analytes effectively through quality assurance and quality control measures.
Detailed
Quality Control Measures
This section underscores the critical importance of quality control (QC) in environmental analysis. The accuracy of results is paramount, especially given that analytical results can influence significant decisions and legal matters. Several measures are discussed to mitigate analyte losses, which can occur at multiple stages: during transportation, storage, processing, and analysis.
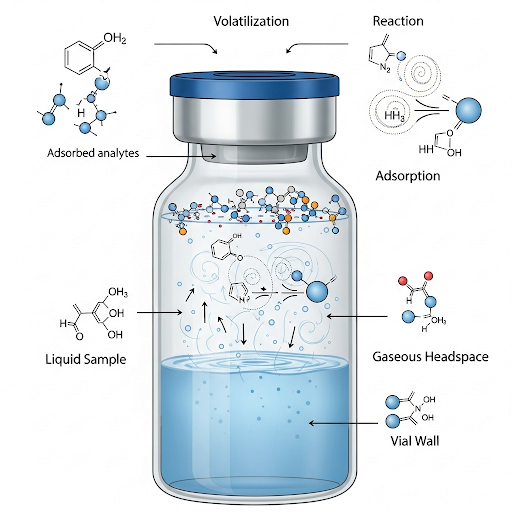
Types of Analyte Losses
- Volatilization: This process primarily refers to the evaporation of analytes from the sample containers. To minimize this, airtight containers and low-temperature conditions are recommended, as increased temperatures can enhance volatilization.
- Reaction: Analytes might undergo reactions during the time between sampling and analysis, leading to potential loss of the compounds of interest, particularly through biodegradation.
- Adsorption: This occurs when analytes bind to the surfaces of containers used for sample storage, which can significantly influence the analysis outcomes. Selecting appropriate materials for containers can help reduce this loss.
Quality Control and Assurance Methods
The section discusses several quality assurance and control methods used to estimate and control these losses, including:
- Laboratory Control Sample: A known standard is added to the sample, and recovery rates are calculated.
- Matrix Spike: Two subsamples are taken; one with an added standard and one without, and their differences help determine recovery rates.
- Blank Analysis: This helps identify any contamination that may lead to sample gain or false positives.
Ultimately, these procedures are designed to maintain the integrity of the analytical results and ensure environmental safety.
Youtube Videos


Audio Book
Dive deep into the subject with an immersive audiobook experience.
Importance of Quality Control in Analysis
Chapter 1 of 6
🔒 Unlock Audio Chapter
Sign up and enroll to access the full audio experience
Chapter Content
Therefore, the burden of the quality control and assurance lies with the analyst and the chemical analyst. So, there are a large number of procedures that are built into the analytical procedures. If you look at a standard method that as we are discussed, this quality control and this Q/QC procedures are inbuilt into the system.
Detailed Explanation
Quality control (QC) is crucial in any analytical process. It ensures that the results obtained from environmental samples are reliable and can be trusted for important decision-making. Analysts must adhere to established QC measures, which are incorporated into standard methods. These procedures help in detecting and reducing errors that can occur during sample analysis.
Examples & Analogies
Think of quality control in analysis like the safety checks performed on an airplane before takeoff. Just as these checks are crucial to ensure the plane is safe for flight, QC measures in analysis ensure that the results are accurate for environmental safety.
Sources of Analyte Loss
Chapter 2 of 6
🔒 Unlock Audio Chapter
Sign up and enroll to access the full audio experience
Chapter Content
The possible analyte losses occur first in the transportation of the sample. Second, which occur in the storage, then in processing, the fourth in the analytical instrument itself or the chemical analysis instrument part of it.
Detailed Explanation
Analyte losses can occur at various stages: during transportation of samples, in the way samples are stored, during the processing of those samples, and even within the analytical instruments used for testing. Understanding these stages is critical to minimizing loss and ensuring the integrity of the sample.
Examples & Analogies
Imagine you are carrying a glass of water. If you walk quickly (transportation), keep the glass uncovered (storage), spill some while handling it (processing), or have a faulty glass that leaks (instrument), it will have less water than when you started. Each stage affects the amount of water left, just as it affects analytes.
Types of Analyte Losses: Volatilization
Chapter 3 of 6
🔒 Unlock Audio Chapter
Sign up and enroll to access the full audio experience
Chapter Content
One of the main first things is volatilization, which is evaporation of the sample, evaporation of the analyte from the water sample or the filter or anything.
Detailed Explanation
Volatilization refers to the process where a substance evaporates from liquid samples into the air. This is significant for volatile compounds found in water samples, as these can easily escape, leading to inaccurate readings of their concentration. Minimizing exposure to air and using airtight containers are strategies to mitigate this effect.
Examples & Analogies
Consider how perfume quickly disperses into the air after being sprayed. Just like the scent itself evaporates, volatile compounds in samples can escape into the atmosphere if not contained properly.
Types of Analyte Losses: Reaction and Biodegradation
Chapter 4 of 6
🔒 Unlock Audio Chapter
Sign up and enroll to access the full audio experience
Chapter Content
The second part of it is reaction. This reaction could be many things. Reaction could be biodegradation, it could be reaction with other entities in the system which is things which are already present in the sample.
Detailed Explanation
Reacting substances can degrade or alter the analyte. Biodegradation, where microorganisms break down substances, is a significant concern. The timing between sampling and analysis can affect how much of the analyte is left, especially if the analyte undergoes chemical changes when exposed to other materials or environmental conditions.
Examples & Analogies
Think about how a banana turns brown over time when left out. This 'reaction' is akin to how certain analytes can degrade or change when left untested for too long, affecting the accuracy of measurements.
Types of Analyte Losses: Adsorption
Chapter 5 of 6
🔒 Unlock Audio Chapter
Sign up and enroll to access the full audio experience
Chapter Content
Third one is adsorption. So, the adsorption occurs through any solid surface during the processing, collection and processing, and one of the solid surfaces that you can generally see is solid surfaces we are looking at adsorption is the container itself.
Detailed Explanation
Adsorption occurs when analytes cling to the surfaces of containers or other materials during collection and processing. This can lead to a reduced concentration in the sample as the analytes are trapped on the surfaces instead of remaining in the liquid. Selecting appropriate container materials can minimize this loss.
Examples & Analogies
Imagine syrup in a glass. If the glass is sticky or dirty, some syrup will cling to the sides instead of being consumed. Similarly, analytes can stick to the walls of containers, leading to less analyte available for measurement.
Preventing Analyte Loss - Container Choice
Chapter 6 of 6
🔒 Unlock Audio Chapter
Sign up and enroll to access the full audio experience
Chapter Content
For example we are looking at organics. There is a general theory that rule of thumb that organics like to bind with other organics. Therefore, the collection vessel, this collection and storage containers should be inorganic.
Detailed Explanation
When storing organic substances, it is advisable to use inorganic containers like glass to prevent adsorption. Organic materials in plastic can attract organic analytes, leading to higher losses. The choice of container material can significantly impact the reliability of the analysis.
Examples & Analogies
Choosing the right bag for groceries: If you're buying fruits that release ethylene gas, placing them in a plastic bag can ripen them too quickly. Similarly, using the right container can prevent analyte loss during sample analysis.
Key Concepts
-
Quality Control: Procedures ensuring accuracy in environmental analysis.
-
Analyte Losses: Losses occurring during sampling, analysis, and transport.
-
Standard Addition: A method for minimizing error by adding known analytes to samples.
-
Matrix Effects: Influence of other substances in the sample on the analysis of the target analyte.
Examples & Applications
Using airtight containers during transportation to avoid volatilization.
Conducting blank analyses to check for contamination before running actual samples.
Memory Aids
Interactive tools to help you remember key concepts
Rhymes
To keep analytes in our sight, airtight containers are just right.
Stories
Imagine a scientist working hard in the lab. They collect samples but realize their analytes evaporate like water on a hot day! They then learn to use airtight jars to trap the important bits — no more losing precious data!
Memory Tools
Remember 'V.R.A' for Volatilization, Reaction, Adsorption — the three types of analyte losses.
Acronyms
Use 'QC' for Quality Control – it's essential to keep data reliable!
Flash Cards
Glossary
- Volatilization
The process of evaporation of analytes from a sample, affecting the accuracy of measurements.
- Adsorption
The adhesion of molecules from a gas, liquid, or dissolved solid to a surface, which can lead to analyte losses.
- Recovery Efficiency
The percentage measure of how much of an analyte is recovered during analysis compared to its true concentration.
- Matrix Spike
A method where a known quantity of analyte is added to a sample to check for recovery rates.
- Control Sample
A sample with known values used to ensure accuracy in analysis.
Reference links
Supplementary resources to enhance your learning experience.