
Troubleshooting and Summary of QA/QC Procedures
Enroll to start learning
You’ve not yet enrolled in this course. Please enroll for free to listen to audio lessons, classroom podcasts and take practice test.
Interactive Audio Lesson
Listen to a student-teacher conversation explaining the topic in a relatable way.
Analyte Losses in Environmental Analysis
🔒 Unlock Audio Lesson
Sign up and enroll to listen to this audio lesson

Today, we'll discuss analyte losses that can occur in environmental samples. Can anyone tell me some reasons why these losses might happen?

Maybe during sampling or transport?
Exactly! Analyte losses can occur during transportation, storage, and analysis. Some key types include volatilization, reactions, and adsorption. Let's break these down. Does anyone know what volatilization means?

It means the sample evaporates, right?
Yes! That's correct! Remember, we can minimize losses by using airtight containers. Now, let's look at reactions. What are some examples of reactions that could lead to analyte loss?

Biodegradation is one I think?
Great answer! Biodegradation is a common concern. It's important because reactions can occur over time, affecting the analyte's integrity. Summarizing, we need to be aware of both transport and storage when setting up our QA procedures.
Methods to Assess Analyte Loss
🔒 Unlock Audio Lesson
Sign up and enroll to listen to this audio lesson

Now that we know about analyte losses, how do we assess and minimize these losses? For starters, can anyone explain what laboratory control samples are?

Are they the samples we analyze to see how much we lost during the process?
Correct! Laboratory control samples can help us understand recovery efficiency. We compare known concentrations to what we retrieve after analysis. What about surrogate standards—who can tell me what they are?
Are they similar to the analyte but not the same?
Absolutely right! Surrogate standards allow us to track extraction efficiency while avoiding contamination issues. And what about matrix spikes? What do they help us accomplish?
They help check the efficiency of the extraction by comparing two sample splits?
Exactly! This gives us a clearer picture of any matrix effects. Great job everyone! Remember, assessing and mitigating loss is essential for quality assurance.
Troubleshooting Sample Gains
🔒 Unlock Audio Lesson
Sign up and enroll to listen to this audio lesson
We have talked about sample losses, but we also need to understand sample gains. Can anyone give me an example of how sample gains might occur?
Maybe from dirty instruments or glassware?
Exactly! Contaminated apparatus can lead to gains, and it complicates the analysis as we might overestimate concentrations. What strategy can we use to minimize sample gains?
We should conduct blank analyses regularly?
Yes! Blank analyses help us identify possible contamination sources in our instruments. What are some types of blanks we can use?
Oh, I know—method blanks and instrument blanks!
Good memory! Using multiple blank types can help isolate contamination issues and maintain data integrity. Let's all remember to include blanks in our QA procedures.
Implementing QA/QC Procedures
🔒 Unlock Audio Lesson
Sign up and enroll to listen to this audio lesson
Finally, let’s talk about the practical implementation of QA/QC procedures. What are the first steps we should take?
We need to calibrate our instruments with standards, right?
Exactly! Calibration establishes true values. What follows calibration?
We need to run replicates to check for repeatability?
Correct! Running replicates helps us assess the precision of the method. What about the importance of recovery in our QA/QC process?
It tells us how well we are retrieving the analytes, right?
Exactly! Tracking recovery rates gives us confidence in our results. Remember, a robust QA/QC process is essential for reliable environmental data.
Introduction & Overview
Read summaries of the section's main ideas at different levels of detail.
Quick Overview
Standard
In this section, various procedures for quality assurance and quality control (QA/QC) are discussed, including the identification of potential analyte losses from sample transportation, storage, reactions, and adsorption. Practical methods to assess and mitigate analyte losses, such as using calibrations, laboratory control samples, and blanks, are emphasized.
Detailed
Summary of QA/QC Procedures
In environmental analysis, ensuring the quality of the results involves meticulous quality assurance (QA) and quality control (QC) practices. Key points covered in this section include:
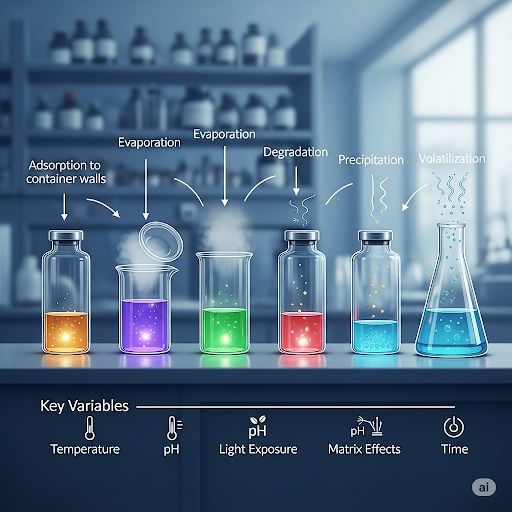
- Problems of Analyte Loss: Analyte losses can occur during sample transportation, storage, processing, and analysis. Key factors include volatilization, reactions such as biodegradation, and adsorption to container surfaces.
- Mitigation Strategies: Employing airtight containers, maintaining low temperatures, and choosing appropriate materials for sample collection can reduce analyte losses. For instance, organic samples should ideally be stored in glass containers to prevent adsorption.
- Recovery Assessment: To check for analyte loss, recovery efficiency can be estimated using standard methods, including laboratory control samples, surrogate standards, and matrix spikes, which help track the integrity of the analysis process.
- Troubleshooting Procedures: Identifying sample gains, which can result from contaminants or apparatus errors, is crucial. Regular blank analyses can help determine issues related to contamination.
- QA/QC Procedures: Establishing a routine with calibration standards, replicates for repeatability, and various blanks is essential in assuring data accuracy.
These protocols underlie the accuracy of environmental analysis, ensuring stakeholders can make informed decisions based on reliable data.
Youtube Videos


Audio Book
Dive deep into the subject with an immersive audiobook experience.
Understanding Sample Losses
Chapter 1 of 4
🔒 Unlock Audio Chapter
Sign up and enroll to access the full audio experience
Chapter Content
We know that there are these losses. So, when you do an analysis, how do you check? How do you check for these losses? We ask this question, can we measure or estimate analyte loss? And the answer is yes and we do it the same way we do, since this is type of measuring the accuracy of the sample, the only way we can check accuracy is by using a standard.
Detailed Explanation
In environmental analysis, a significant concern is the loss of analytes during the sampling and analysis process. We can measure these losses by comparing the expected concentration of an analyte in a sample with the concentration detected in the analysis. This is typically done using standards, which are known quantities of the analyte that allow us to assess the accuracy of our measurements. If we start with a known amount of analyte and measure a lower concentration after processing, we can quantify how much has been lost.
Examples & Analogies
Imagine baking a cake and planning to use a cup of sugar. If, after baking, you find that only three-quarters of a cup of sugar made it into the cake, you need to investigate where the other quarter went. Similarly, in environmental analysis, we assess how much analyte was 'lost' during the process and how we can account for this loss.
Methods for Measuring Recovery Efficiency
Chapter 2 of 4
🔒 Unlock Audio Chapter
Sign up and enroll to access the full audio experience
Chapter Content
The easy one way is to check the loss, so is to check the recovery efficiency, the percentage recovery. So, we define recovery as measured concentration by true concentration. This is the recovery, percent recovery is into 100.
Detailed Explanation
To understand how much analyte was lost during the sampling and analysis process, we calculate the recovery efficiency. This is done by measuring the concentration of the analyte that was recovered after the analysis and comparing it to the known initial concentration (true concentration). The formula is simple: by dividing the measured concentration by the true concentration and then multiplying by 100, we can express it as a percentage. A loss in recovery indicates problems in the sampling process.
Examples & Analogies
Think of it like a student who took a test. If they believe they got 90 out of 100 questions correct (true concentration), but the teacher marks them down and finds they only answered 70 correctly (measured concentration), their recovery is 70%. This percentage reflects how many answers were lost, similar to how we track losses in analyte recovery.
Evaluating Sample Gains and Blanks
Chapter 3 of 4
🔒 Unlock Audio Chapter
Sign up and enroll to access the full audio experience
Chapter Content
Sometimes, we are talking about sample losses. There is also another aspect to sample losses lead to underestimation, which is usually falls under the category of false negative, but there is also another case of false positives, which means that what we are calling us false negative is not just whether it is not a true false answer.
Detailed Explanation
In addition to losses, we also consider sample gains, which can lead to false positives. This happens when contaminants from dirty glassware or instruments incorrectly increase the detected analyte concentration. This could result in overestimating the amount of a pollutant present. To check this contamination, analysts run blanks—clean samples that should measure zero. If a blank shows a positive reading, it indicates contamination somewhere in the process.
Examples & Analogies
Imagine you're drinking orange juice, but you accidentally used a glass that previously held ketchup. If the taste of ketchup faintly mixes into your juice, this is akin to a false positive in analysis—it suggests there's something in your juice that isn't meant to be there. Running a blank is like checking if your glass is clean before drinking to ensure you're not tasting anything unexpected.
Quality Assurance and Quality Control (QA/QC) Procedures
Chapter 4 of 4
🔒 Unlock Audio Chapter
Sign up and enroll to access the full audio experience
Chapter Content
To summarize this recovery for losses is blank analysis for this thing. There are different kinds of blanks. There is a method blank. These are all methods of troubleshooting.
Detailed Explanation
To ensure reliable analytical results, various QA/QC procedures are employed. These include calibration with standards, running replicate samples for consistency, and conducting blank analyses to identify contamination. Moreover, determining recovery through controlled samples helps identify potential losses in different stages of the analysis. Overall, following these QA/QC procedures increases the confidence in the data collected through environmental analysis.
Examples & Analogies
This is similar to running a quality check on a factory product. If a manufacturer checks a batch of toys for defects—using standard procedures, testing random samples, and checking against a control toy to identify flaws—they can ensure all toys meet quality standards before reaching customers. Similarly, QA/QC in sampling and analysis ensures data integrity before conclusions are drawn in environmental studies.
Key Concepts
-
Analyte Loss: Analyte losses can occur during sample transportation, storage, and analysis, influenced by factors like volatilization, reactions, and adsorption.
-
Quality Assurance and Control: Essential procedures that ensure the accuracy and reliability of environmental analysis.
-
Recovery Efficiency: Methods such as laboratory control samples and surrogate standards help assess and improve recovery.
-
Sample Gain: Contamination from instruments or glassware can lead to false positives and must be routinely monitored.
Examples & Applications
An example of volatilization is when a water sample is transported in an open container, allowing solvents to evaporate.
Using clean glassware for organic samples minimizes the risk of adsorption, demonstrating importance in QA/QC.
Memory Aids
Interactive tools to help you remember key concepts
Rhymes
When samples we transport, keep them tight as we ought, to minimize loss, a QA/QC thought.
Stories
Once in a lab, a sample lost weight on its journey, because it evaporated, leading to a big worry. They learned to seal tight, and then they were bright!
Memory Tools
Remember 'RACE' for QA/QC: Recovery assessment, Airtight containers, Calibration, and Elimination of contamination.
Acronyms
QAQC
Always Question
Always Check!
Flash Cards
Glossary
- Analyte Loss
The loss of a substance being measured during sampling, transportation, or analysis.
- Volatilization
The process by which a substance transitions from a liquid or solid state to a gas.
- Baseline Analysis
Initial measurements made to establish a reference for comparison.
- Retention Time
The time a compound takes to pass through the chromatographic column.
- Calibration
Aligning the measurement instrument with known standards.
Reference links
Supplementary resources to enhance your learning experience.