
Image Interpretation and Analysis
Enroll to start learning
You’ve not yet enrolled in this course. Please enroll for free to listen to audio lessons, classroom podcasts and take practice test.
Interactive Audio Lesson
Listen to a student-teacher conversation explaining the topic in a relatable way.
Visual Interpretation
🔒 Unlock Audio Lesson
Sign up and enroll to listen to this audio lesson

Today, we will explore visual interpretation techniques used in remote sensing. Can anyone tell me what visual interpretation includes?

Does it involve analyzing the tone and texture of images?
Exactly! Tone and texture are critical. Tone refers to the brightness levels in an image, while texture describes the surface structure of features. How do you think these aspects can help in identifying different land types?

I think texture can help distinguish between urban areas and forests because they have different surface patterns.
Good observation! The differences in texture can indeed aid our interpretation. Other aspects include shape, size, pattern, shadow, and association. Let’s remember these with the acronym TTS PSA, which stands for Tone, Texture, Shape, Size, Pattern, Shadow, and Association. Can you recall one point from that list?

How about the pattern? It helps show how features are distributed, right?
Perfect! Patterns can tell us a lot, especially in identifying human-induced changes in land use. Overall, visual interpretation helps bridge the gap between raw images and practical understanding.
Digital Image Processing Techniques
🔒 Unlock Audio Lesson
Sign up and enroll to listen to this audio lesson

Now, let’s move on to digital image processing. What do you think is the purpose of image classification?

I believe it's to categorize different regions of an image based on what we see.
Exactly! Image classification assigns pixels to categories such as land cover or vegetation types. There are two main methods: supervised and unsupervised classification. Who can explain the difference?
In supervised classification, you provide the system with training data, right? But in unsupervised classification, the system figures it out on its own?
Well summarized! Unsupervised classification can be useful when you lack prior knowledge about the land cover. Now, change detection is another vital technique. Why might detecting change in landscape be important?
Changes could indicate urban expansion or environmental degradation, which can impact planning!
Exactly! Change detection assists in critical decision-making processes. Lastly, indices like NDVI help evaluate vegetation health by analyzing reflectance. Which bands do we use for NDVI?
Near-infrared and red wavelengths!
Correct! Understanding these digital processing techniques equips us with powerful tools for analyzing Earth data.
Introduction & Overview
Read summaries of the section's main ideas at different levels of detail.
Quick Overview
Standard
In this section, we explore the essence of image interpretation and analysis in remote sensing. We discuss visual interpretation components, including tone and texture, and delve into digital image processing, focusing on classification methods, change detection, and index calculations such as NDVI.
Detailed
Detailed Summary: Image Interpretation and Analysis
This section of the chapter focuses on the methods and techniques used for image interpretation and analysis in remote sensing.
Visual Interpretation
Visual interpretation involves assessing images based on several characteristics, notably:
- Tone: The relative brightness of a feature compared to its surroundings.
- Texture: The visual surface and fine structure of objects, important for distinguishing between different land covers.
- Shape: The form and outline of the objects viewed.
- Size: The dimensions of features relative to other elements in the image.
- Pattern: The arrangement of features in space, which can indicate specific land uses.
- Shadow: The presence of shadows can reveal the height of objects and their spatial relationships.
- Association: Understanding how features relate to one another contextually.
These visual components work together to facilitate a meaningful analysis of images.
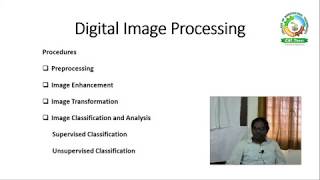
Digital Image Processing
With technological advancements, digital image processing has become critical, including:
- Image Classification: This process involves categorizing pixels in an image into predefined categories, such as land cover types. It can be further divided into:
- Supervised Classification: An analyst defines classes based on training data.
- Unsupervised Classification: The system identifies patterns and clusters without prior class definitions.
- Change Detection: This technique compares images taken at different times to identify changes in the landscape, crucial for urban planning and environmental monitoring.
- Index Calculation: Indices like the NDVI (Normalized Difference Vegetation Index) are used to assess vegetation health by comparing the difference in reflectance between near-infrared and red wavelengths.
Understanding these analytical techniques enhances the effectiveness of remote sensing data for various applications in civil engineering, land use planning, and environmental management.
Youtube Videos


Audio Book
Dive deep into the subject with an immersive audiobook experience.
Visual Interpretation
Chapter 1 of 2
🔒 Unlock Audio Chapter
Sign up and enroll to access the full audio experience
Chapter Content
Involves analyzing image features using:
- Tone
- Texture
- Shape
- Size
- Pattern
- Shadow
- Association
Detailed Explanation
Visual interpretation of images in remote sensing refers to the process of analyzing various visual characteristics in the images to extract meaningful information. Each attribute provides specific insights:
- Tone relates to the brightness or darkness of the color in the image, which can signify different land types (like dark water bodies versus bright sandy areas).
- Texture refers to the pattern of tones or colors that can provide clues about the surface roughness or types of vegetation (e.g., grass shows a finer texture compared to a forest).
- Shape helps identify geographical features (like round lakes or linear roads).
- Size allows for estimation of the scale of features (e.g., a small pond versus a large lake).
- Pattern involves repetitive arrangements, which can indicate man-made structures (like a grid of fields).
- Shadow can provide depth and dimensional understanding of objects, typically aiding in determining the height of buildings.
- Association examines how features relate to each other in the image (like vegetation around a water body).
Examples & Analogies
Imagine you're given a puzzle to solve without knowing what the picture is. Each piece has different colors, textures, and shapes. By examining these attributes – like a bright piece might indicate the sun or a dark piece might be a tree – you start piecing together the larger image. In a similar way, remote sensing analysts look at the tones, shapes, and patterns in images to understand what they see – just like reconstructing a puzzle.
Digital Image Processing
Chapter 2 of 2
🔒 Unlock Audio Chapter
Sign up and enroll to access the full audio experience
Chapter Content
- Image Classification: Assigning pixels to categories (land cover, vegetation).
- Supervised Classification
- Unsupervised Classification
- Change Detection: Comparing temporal images for changes.
- Index Calculation: e.g., NDVI (Normalized Difference Vegetation Index) for vegetation health.
Detailed Explanation
Digital image processing uses computer algorithms to analyze and interpret images captured from remote sensing technologies. It includes several processes:
- Image Classification categorizes each pixel in an image into predefined classes, such as water, urban areas, or forests. There are two main types:
- Supervised Classification where the user defines sample areas to guide the algorithm in identifying different land cover types.
- Unsupervised Classification where the algorithm automatically groups pixels into categories based on their properties without prior knowledge.
- Change Detection involves comparing images taken at different times to identify changes, such as deforestation or urban expansion.
- Index Calculation like NDVI computes vegetation health indices based on the reflectance of certain wavelengths of light. NDVI is widely used to monitor plant health by comparing light absorption and reflectance.
Examples & Analogies
Think of digital image processing like having a box of crayons and a coloring book. When you color an image in a coloring book, you decide which colors (or categories) go in each space—this is like image classification. Sometimes, you may need to reference the picture on the front of the book (supervised classification) to know what colors to use or sometimes just pick colors as you go (unsupervised classification).
For change detection, imagine you photograph a plant monthly, you can spot changes by comparing the different monthly photos (like noticing if the plant is growing or wilting). And when calculating an index like NDVI, it’s similar to checking how dark the leaves are – darker leaves usually mean a healthier plant, just like using a scale to see if your weight is healthy.
Key Concepts
-
Visual Interpretation: Involves analyzing image features like tone, texture, and pattern.
-
Image Classification: Process to categorize pixels into predefined classes.
-
Change Detection: Technique to identify changes over time by comparing temporal images.
-
NDVI: Index used to assess vegetation health through reflectance measurements.
Examples & Applications
Using NDVI to monitor crop health in agriculture by analyzing satellite images.
Visual interpretation of urban areas using texture and patterns to assess land use changes.
Memory Aids
Interactive tools to help you remember key concepts
Rhymes
To interpret an image, look at tone and texture, And patterns and shapes offer clues to the mixture.
Stories
Imagine a detective analyzing a landscape. Each clue—tone, texture, shape—is a piece of the story that reveals the mystery of the land.
Memory Tools
Remember TTS PSA for image analysis: Tone, Texture, Shape, Size, Pattern, Shadow, Association.
Acronyms
For NDVI, think 'NIR-Red' for understanding how well vegetation is fed.
Flash Cards
Glossary
- Visual Interpretation
The process of analyzing images based on characteristics such as tone, texture, and shape.
- Image Classification
The method of categorizing pixels in an image into predefined classes for analysis.
- NDVI
Normalized Difference Vegetation Index; a measurement that assesses vegetation health from satellite imagery.
- Change Detection
A technique that compares images taken at different times to identify changes in land cover or use.
Reference links
Supplementary resources to enhance your learning experience.