
Fine-grained soils
Enroll to start learning
You’ve not yet enrolled in this course. Please enroll for free to listen to audio lessons, classroom podcasts and take practice test.
Interactive Audio Lesson
Listen to a student-teacher conversation explaining the topic in a relatable way.
Classification of Fine-grained Soils
🔒 Unlock Audio Lesson
Sign up and enroll to listen to this audio lesson

Today, we'll explore the classification of fine-grained soils. Can anyone remind us how these soils are defined?

I think fine-grained soils are those with particle sizes smaller than 0.075 mm, right?
Exactly! And what happens when we incorporate water into clay particles?

Water makes clay particles more plastic because it adheres to their flaky shape!
Great observation! This plasticity is measured using the plasticity index and the liquid limit. A memory aid for this is 'Plasticity needs Water!' What do we classify into clays, silts, or organic soils?

Could it be based on the values indicated on the plasticity chart?
Yes! The points on the chart guide us in the classification process. Remember 'C' for clay, 'M' for silt, and 'O' for organic? Let’s summarize: fine-grained soils contain particles <0.075 mm, and we use a plasticity chart for classification.
Plasticity Index and Activity
🔒 Unlock Audio Lesson
Sign up and enroll to listen to this audio lesson

Now that we understand the classification, let's discuss plasticity. Can someone define plasticity index?

Is it the difference between the liquid limit and the plastic limit?
Correct! The plasticity index, or PI, directly relates to how much water the soil can hold and its deformation behavior. What else do we know about the activity of clayey soils?
I remember it being the ratio of plasticity index to the percentage of clay particles by weight!
Exactly! So, if we say a soil has high activity, what does that imply?
It means the soil can swell and shrink a lot with water changes!
Precisely! More water means more plasticity, affecting construction practices. To summarize, a higher activity means more susceptibility to changes.
Liquidity Index and Visual Classification
🔒 Unlock Audio Lesson
Sign up and enroll to listen to this audio lesson
Let's turn our attention to the liquidity index. Who can explain what it indicates?
It measures how water content affects the state of fine soils in relation to Atterberg limits, right?
Correct! The liquidity index helps classify soils as liquid or stiff based on current water content. Who remembers the classifications?
We can have very soft, soft, medium stiff, and stiff!
Well done! Remember the hint: 'If it's liquid, it’s not solid!' Now, what about visual classification?
We can identify sand, silt, and clay by texture and how they react to touch!
Absolutely! Summarizing, liquidity index gives us insight into soil consistency, while visual classification aids in quick field assessments.
Using the Plasticity Chart
🔒 Unlock Audio Lesson
Sign up and enroll to listen to this audio lesson
Now that we understand the fundamentals, let's apply them by using the plasticity chart. How do we find the classification of a given soil with W_L and W_P values?
We would plot the values on the plasticity chart and see where they fall!
Exactly, and based on where they land, we can find out if it’s high, intermediate, or low plasticity. Can anyone give an example?
If W_L = 48% and W_P = 26%, we would calculate the plasticity index. So, PI = 48 - 26 = 22%.
Right again! And since 48% falls between 35 and 50%, how would we classify it?
It’s CI, clay of intermediate plasticity!
Perfect! Let's summarize: we use W_L and W_P in conjunction with the plasticity chart for effective soil classification.
Introduction & Overview
Read summaries of the section's main ideas at different levels of detail.
Quick Overview
Standard
This section discusses the classification of fine-grained soils according to the Indian Standard Soil Classification System (ISSCS), focusing on their particle size, plasticity, and organic content. It emphasizes the significance of the plasticity chart, activity, and liquidity index in determining the behavior of these soils.
Detailed
Fine-grained soils, which contain more than 50% particles smaller than 0.075 mm, play a crucial role in the field of geotechnical engineering. This section outlines their classification into clays, silts, and organic soils using the Indian Standard Soil Classification System (ISSCS). The emphasis is placed on the plasticity chart, where the plasticity index (I) and liquid limit (W_L) are used to categorize the soil. Three plasticity classes are established: low, intermediate, and high plasticity based on liquid limit values. The importance of organic content is also stressed, and the classification of soils by group symbols provides a clear framework for identifying soil types. Additionally, the section covers key concepts like activity and liquidity index which help determine the plastic behavior of these soils, along with visual identification techniques for field classification. These fundamental properties significantly impact the engineering behavior and suitability of soils for construction.
Youtube Videos
![[ADI] CLASSIFICATION OF SOIL (CE) EXPLAINED!!! PART-1/2](https://img.youtube.com/vi/UNgzyAt93LU/mqdefault.jpg)

Audio Book
Dive deep into the subject with an immersive audiobook experience.
Definition of Fine-grained Soils
Chapter 1 of 10
🔒 Unlock Audio Chapter
Sign up and enroll to access the full audio experience
Chapter Content
Fine-grained soils are those for which more than 50% of the material has particle sizes less than 0.075 mm.
Detailed Explanation
Fine-grained soils are defined by their particle size, where more than half of the material consists of very small particles, specifically those smaller than 0.075 mm. This classification is essential in soil mechanics and engineering because the properties and behavior of these soils differ significantly from coarser soils.
Examples & Analogies
Imagine a jar filled with sand and flour. The sand represents coarse soil with larger particles, while the flour represents fine-grained soil. If more than half of the jar is filled with flour, we could classify that mixture as fine-grained soil.
Properties of Fine-grained Soils
Chapter 2 of 10
🔒 Unlock Audio Chapter
Sign up and enroll to access the full audio experience
Chapter Content
Clay particles have a flaky shape to which water adheres, thus imparting the property of plasticity.
Detailed Explanation
Clay particles have a unique shape and surface characteristics that allow water to stick to them, resulting in plasticity. This means that when clay is wet, it can be molded and shaped easily, which is a critical property in construction and soil behavior. Plasticity is essential for understanding how soil will behave under different conditions, such as wetting and drying.
Examples & Analogies
Think of modeling clay. When you add water to it, it's easy to mold into different shapes. Similarly, when clay soil gets wet, it behaves in a malleable way, allowing engineers to work with it more efficiently.
Plasticity Chart and Soils Classification
Chapter 3 of 10
🔒 Unlock Audio Chapter
Sign up and enroll to access the full audio experience
Chapter Content
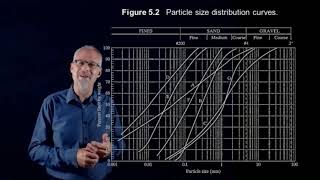
A plasticity chart, based on the values of liquid limit (W_L) and plasticity index (I_P), is provided in ISSCS to aid classification. The 'A' line in this chart is expressed as I_P = 0.73(W_L - 20).
Detailed Explanation
The plasticity chart is a tool used to classify fine-grained soils based on two key properties: the liquid limit (W_L) and the plasticity index (I_P). The liquid limit indicates the moisture content at which the soil changes from a plastic to a liquid state, while the plasticity index reflects the range of moisture content over which the soil remains plastic. The 'A' line separates different classifications of fine soils on this chart.
Examples & Analogies
Picture a temperature gauge that indicates cold, warm, and hot based on numeric values. The plasticity chart works similarly; it provides a visual way to categorize soil types based on their properties, helping geotechnical engineers make informed decisions.
Classification of Fine Soils
Chapter 4 of 10
🔒 Unlock Audio Chapter
Sign up and enroll to access the full audio experience
Chapter Content
Depending on the point in the chart, fine soils are divided into clays (C), silts (M), or organic soils (O). The organic content is expressed as a percentage of the mass of organic matter in a given mass of soil to the mass of the dry soil solids.
Detailed Explanation
Fine soils can be classified based on their position on the plasticity chart into three main categories: clays, silts, and organic soils. This classification is crucial for understanding how the soil behaves. For example, clays tend to swell and shrink more than silts, and organic soils have unique properties due to their organic content, which is calculated as a percentage.
Examples & Analogies
Imagine sorting your clothes into categories: shirts, pants, and jackets. Each category has different qualities, just like clays, silts, and organic soils have distinct properties influencing their behavior and applications.
Plasticity Divisions
Chapter 5 of 10
🔒 Unlock Audio Chapter
Sign up and enroll to access the full audio experience
Chapter Content
Three divisions of plasticity are also defined as follows: Low plasticity W_L < 35%; Intermediate plasticity 35% < W_L < 50%; High plasticity W_L > 50%.
Detailed Explanation
The plasticity of fine-grained soils is divided into three categories based on their liquid limits: low plasticity, intermediate plasticity, and high plasticity. These divisions help engineers predict how the soil will behave under different moisture conditions, which is critical during construction and other earthwork.
Examples & Analogies
Consider three different types of dough: cookie dough (low plasticity), bread dough (intermediate plasticity), and pizza dough (high plasticity). Each type behaves differently when shaped or baked, just like different plasticity soils behave under various conditions.
Group Symbols for Soil Classification
Chapter 6 of 10
🔒 Unlock Audio Chapter
Sign up and enroll to access the full audio experience
Chapter Content
Soil classification using group symbols is as follows: Coarse soils (like GW, GP), Fine soils (like ML, CL).
Detailed Explanation
The Indian Standard Soil Classification System (ISSCS) employs group symbols for easy soil classification. These symbols provide a shorthand way to identify soil types and their characteristics, essential for engineers and geologists in documentation and communication.
Examples & Analogies
Think of an airport that uses IATA codes like LAX for Los Angeles International Airport. Likewise, these group symbols act as codes for different soil types, making it easier for professionals to discuss and assess soil characteristics.
Activity of Clayey Soils
Chapter 7 of 10
🔒 Unlock Audio Chapter
Sign up and enroll to access the full audio experience
Chapter Content
Activity represents the degree of plasticity related to the clay content: Activity Classification < 0.75 Inactive, 0.75 - 1.25 Normal, > 1.25 Active.
Detailed Explanation
Activity in clayey soils describes how much the soil will expand or contract based on its water content relative to its plasticity index. This classification helps in understanding how certain soils might behave under load or when wet.
Examples & Analogies
Think of a sponge. A dry sponge is hard and does not change size much (inactive), a damp sponge expands slightly (normal), but a soaked sponge swells significantly (active). Clayey soils behave similarly in response to water.
Liquidity Index
Chapter 8 of 10
🔒 Unlock Audio Chapter
Sign up and enroll to access the full audio experience
Chapter Content
The liquidity index (LI) provides a quantitative measure of the present state: > 1 Liquid, 0.75 - 1.00 Very soft, 0.50 - 0.75 Soft.
Detailed Explanation
The liquidity index quantifies the current state of fine soils based on their moisture content in relation to their consistency limits. This index helps in assessing how 'wet' or 'soft' the soil is, which is crucial for construction and foundation work.
Examples & Analogies
Consider the difference between a soupy mixture and a thick paste. The liquidity index tells you how close the soil is to being like the soup (liquid state) or paste (solid state), helping engineers understand how to work with the soil effectively.
Visual Classification of Soils
Chapter 9 of 10
🔒 Unlock Audio Chapter
Sign up and enroll to access the full audio experience
Chapter Content
Soils possess a number of physical characteristics which can be used as aids to identification in the field.
Detailed Explanation
Visual classification involves using physical characteristics of soil, such as texture and grittiness, to identify its type. This can be done in the field without specialized equipment, making it accessible for early assessments.
Examples & Analogies
It's akin to tasting a dish to identify its ingredients. Just by feeling the soil and observing its features, you can get clues about what it is, just like tasting might reveal if a dish has garlic, salt, or sweetness.
Worked Example of Soil Classification
Chapter 10 of 10
🔒 Unlock Audio Chapter
Sign up and enroll to access the full audio experience
Chapter Content
The following test results were obtained for a fine-grained soil: W_L = 48%; W_P = 26%; Clay content = 55%; Silt content = 35%; Sand content = 10%.
Detailed Explanation
A worked example demonstrates how to classify a given fine-grained soil using the previously mentioned criteria. By calculating the plasticity index and determining the liquidity index, one can accurately categorize the soil within the ISSCS.
Examples & Analogies
Think of solving a math problem step-by-step. Just as you apply formulas to arrive at the correct answer, engineers systematically analyze soil samples to ensure they classify and understand them properly for construction projects.
Key Concepts
-
Fine-grained soils: Contain over 50% particles smaller than 0.075 mm.
-
Plasticity Index: Difference between liquid limit and plastic limit, indicating soil plasticity.
-
Activity: Ratio indicating the swelling/shrinking potential of clayey soils.
-
Liquidity Index: Measure of soil consistency based on water content.
-
Visual Classification: A method of identifying soils based on tactile characteristics.
Examples & Applications
A soil with a liquid limit of 45% and a plastic limit of 30% would have a plasticity index of 15%.
If a soil has 60% clay content and a plasticity index of 20, its activity would be calculated as 20/60 = 0.33, indicating it's inactive.
Memory Aids
Interactive tools to help you remember key concepts
Rhymes
Fine-grained soil, it’s quite a sight, smaller than seventy-five microns, perfectly right!
Stories
Imagine a group of clay particles at a party; they expand and dance when water is present and clump together when dry. They playfully change their shapes, reflecting their plasticity!
Memory Tools
Remember 'PALS' - Plasticity, Activity, Liquidity, Soil classification!
Acronyms
PI - Plasticity Index
Just remember the PI formula
Flash Cards
Glossary
- Finegrained soils
Soils with more than 50% of particles smaller than 0.075 mm.
- Plasticity Index (PI)
The difference between the liquid limit and the plastic limit of soil.
- Plastic Limit (W_P)
The water content at which soil changes from a plastic state to a brittle state.
- Liquid Limit (W_L)
The water content at which soil changes from a plastic state to a liquid state.
- Activity
The ratio of the plasticity index to the percentage of clay particles by weight, indicating the clay's swelling and shrinkage potential.
- Liquidity Index (LI)
A measure indicating the consistency of a soil based on its water content relative to Atterberg limits.
Reference links
Supplementary resources to enhance your learning experience.