
Liquidity Index
Enroll to start learning
You’ve not yet enrolled in this course. Please enroll for free to listen to audio lessons, classroom podcasts and take practice test.
Interactive Audio Lesson
Listen to a student-teacher conversation explaining the topic in a relatable way.
Introduction to Liquidity Index
🔒 Unlock Audio Lesson
Sign up and enroll to listen to this audio lesson

Today we're discussing the liquidity index, which is essential for understanding soil behavior. Can anyone tell me why knowing soil liquidity is important?

I think it helps determine how wet or dry the soil is and how well it can support structures.
Exactly! The liquidity index measures the current water content compared to the liquid and plastic limits of the soil. Let's remember this concept using the acronym 'LI': Liquid Indicator.

So, does that mean a higher LI indicates wetter soil?
Yes, great observation! An LI over 1 signifies liquid conditions. Now, what do you think a soil with an LI of 0.5 signifies?

That would be soft soil?
Correct! Soft soils can pose challenges in construction. Let's summarize: LI helps classify soil conditions. Can anyone recall the classification thresholds?
Classification by Liquidity Index
🔒 Unlock Audio Lesson
Sign up and enroll to listen to this audio lesson

Let’s review the classifications of the liquidity index. What are the categories?

There are liquid, very soft, soft, medium stiff, stiff, and semi-solid!
Fantastic! Each of these classifications relates directly to the water content of the soil. Now, can anyone explain the implications of having a soil categorized as 'very soft'?
It probably means it can't carry heavy loads without collapsing?
Correct! Very soft soils require careful management in engineering practices. Let’s summarize: the classification system helps us assess soil suitability for construction.
Worked Examples and Applications
🔒 Unlock Audio Lesson
Sign up and enroll to listen to this audio lesson
Let’s work through an example. Given a soil with a moisture content of 39% and a liquid limit of 48%, how can we classify it?
We need to calculate the plasticity index first, right?
Exactly! The plasticity index (PI) can be calculated as LI = (W_L - W_P). What do you get?
If W_L is 48% and W_P is 26%, then PI equals 22%.
Good job! Now plug that into the liquidity index formula. What’s the LI?
The LI would be 0.59!
Perfect! So we classify it as normal activity and soft consistency. Remember, practicing these examples reinforces your understanding of the liquidity index in soil mechanics.
Introduction & Overview
Read summaries of the section's main ideas at different levels of detail.
Quick Overview
Standard
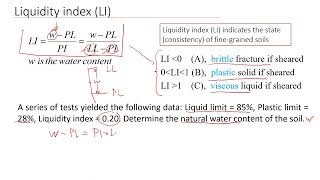
The liquidity index (LI) classifies fine soils based on their current water content compared to consistency limits, providing insights into their consistency and plasticity. It allows engineers to determine the suitability of soils for construction based on their liquidity state ranging from stiff to liquid.
Detailed
Liquidity Index Overview
The liquidity index (LI) is a critical parameter in soil mechanics, especially for fine-grained soils where clay particles dominate. The current state of these soils, which influences their behavior under loading and environmental changes, is directly tied to their water content. This section introduces the liquidity index as a quantitative measure of soil consistency based on the water content relative to the Atterberg limits—specifically the liquid limit (W_L) and plastic limit (W_P).
Classification by Liquidity Index
The liquidity index is classified as follows:
- > 1: Liquid
- 0.75 - 1.00: Very soft
- 0.50 - 0.75: Soft
- 0.25 - 0.50: Medium stiff
- 0 - 0.25: Stiff
- < 0: Semi-solid
This classification helps in understanding the mechanical properties of the soil, thereby guiding construction practices. For example, a soil classified as 'very soft' would be unsuitable for supporting heavy structures without significant stabilization, while 'stiff' or 'medium stiff' soils may have better load-bearing capacities. Through practical examples and the interpolative nature of the relationships within hydrating soils, the liquidity index connects theoretical aspects of soil classification to practical engineering scenarios.
Youtube Videos


Audio Book
Dive deep into the subject with an immersive audiobook experience.
Understanding Liquidity Index
Chapter 1 of 2
🔒 Unlock Audio Chapter
Sign up and enroll to access the full audio experience
Chapter Content
In fine soils, especially with clay size content, the existing state is dependent on the current water content (w) with respect to the consistency limits (or Atterberg limits). The liquidity index (LI) provides a quantitative measure of the present state.
Detailed Explanation
The liquidity index (LI) measures how much water is present in fine soils, particularly those containing clay. It relates the current water content of the soil to its consistency limits—these limits define the transition points between different states of soil, such as plastic or liquid. By comparing the current water content (w) to these limits, we can determine the liquidity index and understand the soil's behavior under different moisture conditions.
Examples & Analogies
Think of clay soil like a sponge. When it’s dry, it is hard and crumbly; when it absorbs water, it softens and can become very wet, resembling a thick batter. The liquidity index helps us understand how wet or dry the soil is in relation to its ability to flow or hold its shape, similar to how a sponge can hold water versus when it is partially dry.
Classification Based on Liquidity Index
Chapter 2 of 2
🔒 Unlock Audio Chapter
Sign up and enroll to access the full audio experience
Chapter Content
Classification as per liquidity index is: Liquidity index Classification > 1 Liquid 0.75 - 1.00 Very soft 0.50 - 0.75 Soft 0.25 - 0.50 Medium stiff 0 - 0.25 Stiff < 0 Semi-solid
Detailed Explanation
The liquidity index classification provides a scale to sort soils based on how liquid or stiff they are at a given moisture content. If the LI is greater than 1, the soil is considered liquid, meaning it can flow easily. As the index decreases to less than 0, the soil becomes more solid. This classification helps in predicting soil behavior under different conditions, such as during construction or when wet environmental conditions are present.
Examples & Analogies
Imagine you are making a cake batter. If you add too much water, the batter becomes liquid and spreadable (LI > 1). If you add just the right amount of water, it's thick but still flows (0.50 < LI < 0.75). If you add too little water, it becomes hard and difficult to mix (LI < 0.25). This analogy illustrates how the liquidity index helps measure the soil's workability, similar to how consistent a cake batter should be.
Key Concepts
-
Current water content affects soil behavior: The liquidity index measures how the water content influences the state of soil.
-
Classification helps in engineering: Understanding the liquidity index spectrum aids engineers in assessing load-bearing capacities.
-
Atterberg limits are essential: The LI relies on values derived from the Atterberg limits to define soil states.
Examples & Applications
A soil with a moisture content of 39% and a liquid limit of 48% can be classified as having an LI of 0.59, indicating it is of normal activity and soft consistency.
In practice, very soft soils (LI ≥ 0.75) might be unfit for construction without stabilization.
Memory Aids
Interactive tools to help you remember key concepts
Rhymes
Soft as a feather, stiff as a board, liquidity shows if soil's adored.
Stories
Once, in a tiny village, a builder learned that soil with excessive water became liquid while the stiff soil was sturdy and supportive for houses.
Memory Tools
Remember 'LSMSS' for Liquidity Index categories: Liquid, Soft, Medium Stiff, Stiff, Semi-solid.
Acronyms
LI
Liquid Indicator helps you measure soil feel.
Flash Cards
Glossary
- Liquidity Index
A quantitative measure of the consistency of fine soils based on their water content relative to the Atterberg limits.
- Atterberg Limits
The moisture contents at which a soil changes its state from solid to liquid or plastic.
- Plasticity Index
The numerical difference between the liquid limit and the plastic limit of a soil.
- Consistency Limits
The boundaries of the water content states of the soil determined by the Atterberg limits.
- Soft Soil
Soil that can easily deform under load due to high water content.
Reference links
Supplementary resources to enhance your learning experience.