
Plasticity Chart
Enroll to start learning
You’ve not yet enrolled in this course. Please enroll for free to listen to audio lessons, classroom podcasts and take practice test.
Interactive Audio Lesson
Listen to a student-teacher conversation explaining the topic in a relatable way.
Understanding Plasticity and the Plasticity Chart
🔒 Unlock Audio Lesson
Sign up and enroll to listen to this audio lesson

Today, we’ll explore the plasticity chart, which helps classify fine-grained soils using liquid limit and plasticity index. Can anyone specify what plasticity is?

Isn’t it about how much the soil can change shape without breaking?
Exactly! Plasticity refers to the ability of soil to deform when wet. The plasticity chart allows us to see where a soil falls in terms of its plasticity levels based on its liquid limit and plasticity index.

What are the key lines we see in the plasticity chart?
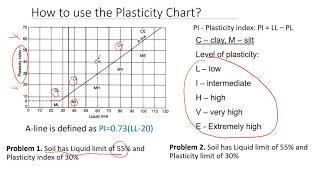
Good question! The 'A' line separates soil types into clays, silts, and organics based on their plasticity index and liquid limit values. Remember, the formula for the 'A' line is I_P = 0.73 (W_L - 20).

How does this affect the classification of the soil?
Depending on where the soil's coordinates fall on the chart, you can classify them as either clays (C), silts (M), or organic soils (O). Let's summarize this: Plasticity relates to shape deformation; the plasticity chart aids classification using 'A' line.
Plasticity Index and Liquid Limit
🔒 Unlock Audio Lesson
Sign up and enroll to listen to this audio lesson

Next, let’s talk about liquid limit and plasticity index. What do you think are their importance in soil classification?
I think they show how much water the soil can hold?
Precisely! The liquid limit (W_L) is the water content at which the soil changes from a plastic to a liquid state. The plasticity index (I_P) is the difference between the liquid limit and the plastic limit. Would anyone like to share the formula for the plasticity index?
It’s I_P = W_L - W_P, right?
Exactly! A higher plasticity index indicates a higher plasticity, meaning the soil can withstand more deformation. It’s crucial for understanding how the soil will perform in construction.

How do we determine if the soil has low, intermediate, or high plasticity then?
Well, like we discussed earlier, soils are categorized based on the ranges of W_L. If W_L is less than 35%, it’s low plasticity; between 35 and 50% is intermediate; and more than 50% shows high plasticity.
Soil Activity and Liquidity Index
🔒 Unlock Audio Lesson
Sign up and enroll to listen to this audio lesson
In this session, we’ll cover soil activity and liquidity index. Who remembers what activity is?
Isn't it about how different soils react to moisture changes?
Correct! The activity is calculated as the plasticity index divided by the percentage of clay content. It tells us how active the clay is — if it swells or shrinks significantly with moisture changes.
What classifications can we determine from the activity?
We classify soils based on activity: less than 0.75 is inactive; 0.75 to 1.25 is normal; and greater than 1.25 is active. Now, what do you think the liquidity index indicates?
It helps to understand the moisture state of the soil, doesn’t it?
Well put! The liquidity index indicates the soil's current moisture state, which is essential for assessing its consistency and performance under load. Remember, a higher liquidity index means a more liquid state!
Soil Classification and Examples
🔒 Unlock Audio Lesson
Sign up and enroll to listen to this audio lesson
Let's wrap up with how the plasticity chart is used for classifying soil types. Can someone share the group symbols for classification?
Like GW for well-graded gravel or CL for clay of low plasticity?
Exactly! Each soil type has a unique symbol based on its characteristics. For finer soils, we also have classifications like ML for low plasticity silt or CH for high plasticity clay. Anyone can give me an example of how to classify a soil?
If a soil has a liquid limit of 48% and a plastic limit of 26%, would it be CI?
That's right! With that liquid limit, you'd classify it as CI, clay of intermediate plasticity. Always remember the moisture state will dictate this classification!
Introduction & Overview
Read summaries of the section's main ideas at different levels of detail.
Quick Overview
Standard
In this section, the plasticity chart aids in classifying fine-grained soils, defining low, intermediate, and high plasticity based on the liquid limit and plasticity index. It explains the division of soils into various classes and the influence of organic content and activity on soil classification.
Detailed
Plasticity Chart Overview
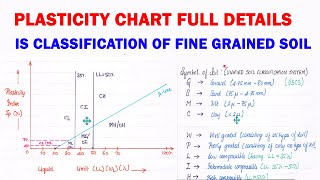
This section delves into the classification of fine-grained soils in the Indian Standard Soil Classification System (ISSCS). The plasticity of soils is a critical property that indicates how soil reacts to water content changes. It comprises several key concepts:
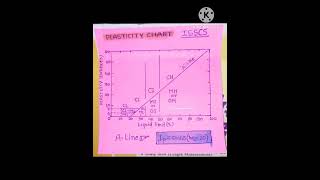
- Plasticity Chart: This chart incorporates liquid limit (W_L) and plasticity index (I_P) values which help classify soils into categories such as clays (C), silts (M), or organic soils (O).
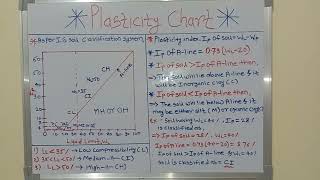
- A-Line: The chart includes an 'A' line that separates different plasticity classes, defined mathematically as I_P = 0.73 (W_L - 20).
- Plasticity Classification: Based on the liquid limit, soils are classified into three plasticity categories:
- Low plasticity (W_L < 35%)
- Intermediate plasticity (35% < W_L < 50%)
- High plasticity (W_L > 50%)
- Organic Content: The organic matter percentage is essential for understanding soil behavior under moisture changes.
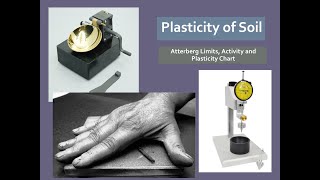
- Activity: Defined as the ratio of the plasticity index to the percentage of clay particles by weight, activity indicates swelling and shrinkage behaviors in clayey soils.
- Liquidity Index (LI): It provides a quantitative measure of the moisture content's effect on soil consistency.
- Visual Classification: Physical characteristics aid in the visual identification of soil types.
With these concepts, soil practitioners can effectively analyze and predict the behavior of fine-grained soils under varying environmental conditions.
Youtube Videos


Audio Book
Dive deep into the subject with an immersive audiobook experience.
Introduction to the Plasticity Chart
Chapter 1 of 5
🔒 Unlock Audio Chapter
Sign up and enroll to access the full audio experience
Chapter Content
A plasticity chart, based on the values of liquid limit (W_L) and plasticity index (I_P), is provided in ISSCS to aid classification.
Detailed Explanation
The plasticity chart is a valuable tool in the Indian Standard Soil Classification System (ISSCS). It uses two key measurements: the liquid limit (W_L) and the plasticity index (I_P). The liquid limit indicates the water content at which soil changes from a plastic to a liquid state, while the plasticity index measures the range of water content over which the soil remains plastic. The chart helps classify different soil types based on these measurements.
Examples & Analogies
Think of the plasticity chart like a tool used to classify types of clay based on how much water they can hold before becoming too wet to form into a shape or too dry to manipulate. Just as a chef needs different tools for different ingredients, civil engineers use the plasticity chart to understand how different soils will behave in construction.
The 'A' Line and Soil Classification
Chapter 2 of 5
🔒 Unlock Audio Chapter
Sign up and enroll to access the full audio experience
Chapter Content
The 'A' line in this chart is expressed as I_P = 0.73(W_L - 20). Depending on the point in the chart, fine soils are divided into clays (C), silts (M), or organic soils (O).
Detailed Explanation
The 'A' line is a crucial part of the plasticity chart that demarcates the different types of fine soils. The equation I_P = 0.73(W_L - 20) describes this line. As you plot the values of the plasticity index and liquid limit on the chart, the position in relation to the 'A' line determines whether the soil falls into the categories of clay, silt, or organic soil. Clay tends to be more plastic and cohesive compared to silt, while organic soils have a different, often looser composition.
Examples & Analogies
Imagine a sorting machine at a factory that separates materials based on size. The 'A' line serves a similar purpose in the plasticity chart. It helps categorize different soil types, similar to how a sorting machine might separate large pebbles from fine sand and silt.
Plasticity Classifications
Chapter 3 of 5
🔒 Unlock Audio Chapter
Sign up and enroll to access the full audio experience
Chapter Content
Three divisions of plasticity are also defined as follows:
- Low plasticity W_L < 35%
- Intermediate plasticity 35% < W_L < 50%
- High plasticity W_L > 50%
The 'A' line and vertical lines at W_L equal to 35% and 50% separate the soils into various classes.
Detailed Explanation
The categorization of plasticity into low, intermediate, and high is determined by the values of the liquid limit (W_L). Soils that fall below 35% are classified as low plasticity, those between 35% and 50% as intermediate plasticity, and those above 50% as high plasticity. This classification is crucial as it affects how the soil behaves under stress and moisture conditions, which is vital for construction and agricultural practices.
Examples & Analogies
Think of plasticity like how different types of dough behave when baking. Low plasticity dough is crumbly like pie crust, intermediate plasticity is stretchy like bread dough, and high plasticity would be like pizza dough that can be shaped and molded more easily due to its moisture content.
Soil Symbol Classification
Chapter 4 of 5
🔒 Unlock Audio Chapter
Sign up and enroll to access the full audio experience
Chapter Content
Soil classification using group symbols is as follows:
Coarse soils
- GW: Well-graded GRAVEL
- GP: Poorly-graded GRAVEL
...
Fine soils
- ML: SILT of low plasticity
- CI: CLAY of intermediate plasticity
- CH: CLAY of high plasticity
...
Detailed Explanation
In the ISSCS, soils are classified into different groups using symbols. Coarse soils are categorized based on their grading quality (well-graded or poorly-graded), while fine soils are categorized based on plasticity. This systematic classification helps engineers and geologists communicate clearly about the characteristics of the soil types they are dealing with, which is essential in designing foundations and other structures.
Examples & Analogies
Think of this classification like labeling different types of ingredients in a pantry. You wouldn’t confuse flour with sugar; similarly, engineers use these symbols to avoid misunderstanding when discussing soil types, ensuring that everyone is on the same page about the materials being used.
Understanding Activity and Liquidity Index
Chapter 5 of 5
🔒 Unlock Audio Chapter
Sign up and enroll to access the full audio experience
Chapter Content
Activity:
- Activity represents the degree of plasticity related to the clay content:
- Activity = (Plasticity Index) / (% clay particles by weight)
Liquidity Index:
- The liquidity index (LI) provides a quantitative measure of the present state expressed as LI = (Water Content - Plastic Limit) / (Liquid Limit - Plastic Limit).
Detailed Explanation
Activity helps to understand how the plasticity of soil changes with clay content. A higher activity indicates a soil that is more responsive to changes in moisture. The liquidity index, on the other hand, demonstrates the current state of a given soil sample based on its water content in relation to its plastic and liquid limits. This can help in determining whether the soil is too soft, stiff, or somewhere in between.
Examples & Analogies
Consider activity like a student’s ability to adapt to changes in their study environment. A highly active student (high activity) adjusts easily whether in a quiet library or a bustling café, while a less active student (low activity) may struggle more. Similarly, soils with higher activity react more dramatically to changes in moisture.
Key Concepts
-
Plasticity: The ability of soil to deform without breaking.
-
Plasticity Chart: A method to classify soils based on liquid limit and plasticity index.
-
Liquid Limit: The water content at which soil transitions from plastic to liquid.
-
Plasticity Index: The range of water content between the liquid limit and plastic limit.
-
Soil Activity: A measure of how much a soil can swell or shrink based on its clay content.
-
Liquidity Index: Indicates how the current water content affects soil consistency.
Examples & Applications
A soil with a liquid limit of 48% and plastic limit of 26% will be classified as CI (clay of intermediate plasticity) based on its position in the plasticity chart.
If a soil has a plasticity index of 22% and a clay content of 55%, its activity will be normal (0.4 calculated).
Memory Aids
Interactive tools to help you remember key concepts
Rhymes
If clay's high at fifty or more, it stretches wide on the floor. If it’s less than thirty-five, it’s low and feels like an easy drive.
Stories
Once upon a time, in a land of soils, the Plasticity Family hosted a contest. The Clays were tall and flexible, silts were soft and fluffy, while the gritty sands just danced around. And together, they showed how weather could change them all!
Memory Tools
Remember PALI: P for Plasticity, A for Activity, L for Liquidity index, I for Index of Plasticity!
Acronyms
Soils CLAY
for Clay
for Low plasticity
for Activity
for Yielding behavior with moisture.
Flash Cards
Glossary
- Plasticity
The property of soil to deform and not break when water is added.
- Liquid Limit (W_L)
The water content at which soil changes from a plastic to a liquid state.
- Plasticity Index (I_P)
The range of water content where soil remains plastic: I_P = W_L - W_P.
- Liquidity Index (LI)
A measure that indicates the current moisture content in a fine soil.
- Soil Activity
A ratio indicating how sensitive a soil is to moisture changes.
- Plasticity Chart
A graphical representation that plots soil's liquid limit and plasticity index for classification.
- ALine
The line on a plasticity chart used to separate soils into different classes.
- Finegrained soils
Soils for which more than 50% of particles are smaller than 0.075 mm.
- Organic Soils
Soils containing a significant amount of organic matter.
Reference links
Supplementary resources to enhance your learning experience.