
Rainfall Data Processing and Analysis
Enroll to start learning
You’ve not yet enrolled in this course. Please enroll for free to listen to audio lessons, classroom podcasts and take practice test.
Interactive Audio Lesson
Listen to a student-teacher conversation explaining the topic in a relatable way.
Data Compilation Methods
🔒 Unlock Audio Lesson
Sign up and enroll to listen to this audio lesson

Let's start with the compilation of rainfall data. This process involves gathering daily, monthly, and annual series. Can anyone explain why we need to compile rainfall data?

It's important to understand patterns in rainfall over time!
Exactly! By compiling this data, we can analyze trends and make better water resource management decisions. What methods can we use to convert point rainfall to areal rainfall?

I remember the Arithmetic Mean Method!

There’s also the Thiessen Polygon Method!
Great job! The Arithmetic Mean provides a simple average while the Thiessen Polygon takes area into account. Let's not forget the Isohyetal Method, using contour lines. Can you all summarize the importance of these methods?

They help distribute rainfall data more accurately across broader areas.
Exactly! This accuracy is crucial for effective water management. Let's move on to statistical analysis!
Statistical Analysis Techniques
🔒 Unlock Audio Lesson
Sign up and enroll to listen to this audio lesson

Now, let’s dive into statistical analysis. Why is it vital to compute metrics like mean, median, and mode from rainfall data?
They help us understand average rainfall!
Absolutely! The mean gives us an average, while median and mode tell us about rainfall distribution. Can anyone explain what standard deviation tells us?
It shows how much the rainfall amounts vary from the average!
Correct! And the coefficient of variation offers a normalized measure of this variability. What about skewness and kurtosis?
Skewness shows the asymmetry of the distribution, and kurtosis shows how peaked the distribution is.
Excellent! These statistical analyses help us understand rainfall patterns comprehensively. Can someone summarize why these analyses matter?
They help identify trends and inform resource management!
Precisely! Understanding these patterns enables better planning and management of water resources. Great job, everyone!
Introduction & Overview
Read summaries of the section's main ideas at different levels of detail.
Quick Overview
Standard
The processing and analysis of rainfall data involves several key methodologies, including compiling daily, monthly, and annual rainfall series, converting point rainfall to areal rainfall, and performing statistical analyses like mean, median, mode, standard deviation, and skewness. Understanding these processes is crucial for effective water resource management in India.
Detailed
Rainfall Data Processing and Analysis
In this section, we explore the critical processes involved in the compilation and analysis of rainfall data. Rainfall data is essential for planning and managing water resources, especially in a country like India that heavily relies on monsoon rainfall.
Data Processing
- Compilation of Rainfall Series: Daily, monthly, and annual series of rainfall data are compiled to provide a comprehensive view of precipitation patterns.
- Conversion Methods: To convert point rainfall data captured at specific locations to areal rainfall data for broader applications, several methodologies are used:
- Arithmetic Mean Method: A simple average of rainfall measurements across several stations.
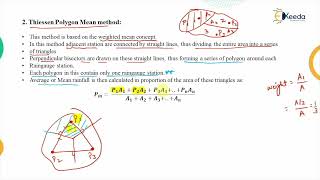
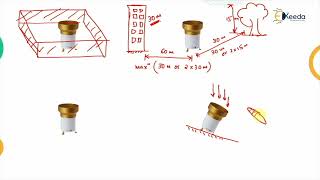
- Thiessen Polygon Method: This method takes into account the area-weighted contributions of multiple rain gauge points.
- Isohyetal Method: A contour-based approach that uses lines of equal rainfall to estimate areal rainfall.
Statistical Analysis
Statistical methods are applied to the compiled rainfall data to derive meaningful insights. Here are the key statistical metrics:
- Mean, Median, Mode: These measures provide central tendency indicators of rainfall data.
- Standard Deviation and Coefficient of Variation: These metrics evaluate the variability of rainfall amounts, essential for understanding the consistency of precipitation patterns.
- Skewness and Kurtosis: These statistical measures assess the shape and distribution characteristics of the rainfall data, helping to identify anomalies or trends over time.
Overall, effective data processing and analysis are fundamental for informed decision-making in hydrology and water resource management.
Youtube Videos


Audio Book
Dive deep into the subject with an immersive audiobook experience.
Data Processing
Chapter 1 of 2
🔒 Unlock Audio Chapter
Sign up and enroll to access the full audio experience
Chapter Content
• Compilation of daily/monthly/annual series
• Conversion of point rainfall to areal rainfall using:
– Arithmetic Mean Method
– Thiessen Polygon Method
– Isohyetal Method
Detailed Explanation
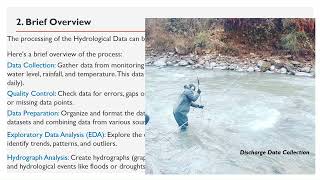
This chunk discusses the initial steps involved in processing rainfall data, which is essential for effective analysis. The data is first compiled into different time series such as daily, monthly, and annual formats. This means that all the daily rainfall measurements are aggregated to present a broader view of rainfall patterns over time. Then, the rainfall collected at specific points (from rain gauges) may not be representative of larger areas. Therefore, conversion techniques are applied to account for this discrepancy, using three primary methods:
- Arithmetic Mean Method: It averages the rainfall values from different points to estimate an area's total rainfall.
- Thiessen Polygon Method: This divides the area into polygons based on rain gauge locations, weighting each gauge's rainfall by the area it covers.
- Isohyetal Method: This involves drawing lines on a map to connect points with equal rainfall, creating a visual representation of rainfall distribution over a larger region.
Examples & Analogies
Think of measuring rainfall like measuring temperature in different rooms of a house. Just like you can’t say the entire house is at the average temperature of different rooms unless you combine and analyze the data correctly, similarly, point rainfall data from different gauges needs proper processing to find out the total rainfall over a larger area.
Statistical Analysis
Chapter 2 of 2
🔒 Unlock Audio Chapter
Sign up and enroll to access the full audio experience
Chapter Content
• Computation of Mean, Median, Mode
• Standard Deviation and Coefficient of Variation
• Skewness and Kurtosis
Detailed Explanation
In this chunk, we delve into the statistical analysis of rainfall data. Various statistical measures are employed:
- Mean: This is the average rainfall calculated by summing all rainfall amounts and dividing by the number of readings. This provides basic insight into typical conditions.
- Median: The middle value when all rainfall data is arranged in order can show the central tendency and is less affected by outliers compared to the mean.
- Mode: This indicates the most frequently occurring rainfall value, which can be quite relevant in understanding common rainfall conditions.
- Standard Deviation: This measures how much rainfall values deviate from the average rainfall, indicating variability in rainfall patterns.
- Coefficient of Variation: This can provide context by showing standard deviation as a percentage of the mean. It helps compare variability between different datasets.
- Skewness: This measures the asymmetry of the rainfall data distribution. Positive skewness indicates more frequent low rainfall with some heavy rainfall events, while negative skewness suggests the opposite.
- Kurtosis: This measures the 'tailedness' of the distribution, indicating the presence of extreme values. High kurtosis means more intense rainfall events are observed than normal.
Examples & Analogies
Imagine you're looking at your friends' scores in a game. The mean score gives you an idea of the average performance, while the median tells you the middle ground between the best and worst scores. If one friend scores incredibly high, it affects the mean but not necessarily the median, showcasing how some players have outlier performances. Similarly, analyzing rainfall helps us understand not just how average the rains are but also how consistent or unpredictable they can be.
Key Concepts
-
Data Processing: Involves compilation and transformation of rainfall data for analysis.
-
Point Rainfall vs. Areal Rainfall: Point rainfall refers to measurements at specific locations, while areal rainfall represents averaged values across an area.
-
Statistical Metrics: Mean, standard deviation, skewness, and kurtosis are essential for understanding and analyzing rainfall data.
Examples & Applications
Using the Arithmetic Mean Method, if three different rain gauges record 50 mm, 60 mm, and 70 mm, the mean rainfall would be (50 + 60 + 70) / 3 = 60 mm.
In applying the Isohyetal Method, rainfall data from several gauges can be plotted on a map to determine areas with equal rainfall, such as through contour lines.
Memory Aids
Interactive tools to help you remember key concepts
Rhymes
When rain we measure, from site to site, the mean helps us find the ideal light.
Stories
Imagine a farmer using rain gauges all around his field, making sure to average out their readings to best know how much water to use for crops.
Memory Tools
To remember the statistical measures: Mean - Most common, Median - Middle path, Mode - Most frequent, Variance - Varying degrees.
Acronyms
MMS (Mean, Median, Standard deviation) - Remembering key statistical measures to analyze rainfall.
Flash Cards
Glossary
- Arithmetic Mean Method
A method to calculate an average rainfall value across different measurement points.
- Thiessen Polygon Method
A method that calculates area-weighted rainfall by creating polygons around each measurement point.
- Isohyetal Method
A technique that uses contour lines to represent equal rainfall amounts across an area.
- Statistical Analysis
Mathematical techniques used to summarize and interpret collected data.
- Standard Deviation
A measure of the amount of variation or dispersion in a set of values.
- Skewness
A measure of the asymmetry of the probability distribution of a real-valued random variable.
- Kurtosis
A statistical measure that describes the shape of a distribution's tails in relation to its overall shape.
Reference links
Supplementary resources to enhance your learning experience.