
HL: Acid-Base Titration Curves and Indicators
Enroll to start learning
You’ve not yet enrolled in this course. Please enroll for free to listen to audio lessons, classroom podcasts and take practice test.
Interactive Audio Lesson
Listen to a student-teacher conversation explaining the topic in a relatable way.
Introduction to Titration Curves
🔒 Unlock Audio Lesson
Sign up and enroll to listen to this audio lesson

Today, we'll discuss titration curves. Can someone explain what a titration curve represents?

Isn't it a graph showing how pH changes as we add titrant?
Exactly! It visually represents the pH change when we gradually add a titrant. What are some key features of this curve?

The initial pH before adding any titrant.
Correct! The initial pH depends on the analyte's strength and concentration. Can you also tell me about the equivalence point?

That's when the moles of titrant and analyte are equal, right?
Yes! The equivalence point is critical. And remember, for strong acid-strong base titrations, the pH at this point is 7. What about weak acid-strong base desiring to change their pH?

It would be above 7 because of the conjugate base.
Exactly! Great work, everyone. Today's lesson is vital for understanding acid-base reactions.
Buffer Region and its Significance
🔒 Unlock Audio Lesson
Sign up and enroll to listen to this audio lesson

Next, let's focus on the buffer region of titration curves. Who can explain what happens in this region?
It's where the pH changes slowly despite adding the titrant, right?
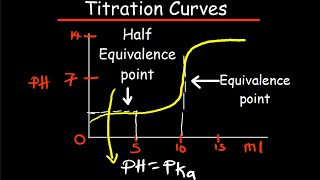
Correct! This region is crucial for weak acid and base titrations. Can anyone recall a key point regarding the half-equivalence point?
That's where the pH equals the pK_a of the weak acid!
Exactly! The half-equivalence point indicates a critical understanding of acidity. What does it tell us about the buffer's effectiveness?
That means the concentrations of the weak acid and its conjugate base are equal.
Well done! Understanding this helps us select suitable indicators. Let's discuss that next.
Selecting Acid-Base Indicators
🔒 Unlock Audio Lesson
Sign up and enroll to listen to this audio lesson
Now, let's discuss acid-base indicators and how to select the right one. What do you understand about acid-base indicators?
They change color at certain pH levels, right?
Exactly! They help us know when to stop titration. What influences the choice of an indicator?
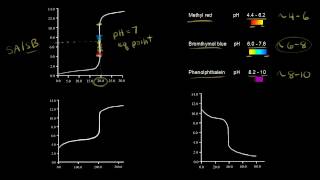
The pK_{In} value needs to be within the steep region of the titration curve.
Correct! For strong acid-strong base titrations, a variety of indicators can work. But for weak acid-strong base titrations, which indicator would you choose?
Phenolphthalein, because it changes color in the alkaline region.
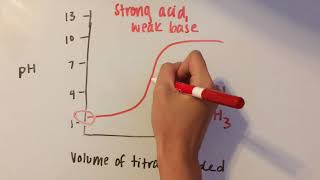
Exactly! And for strong acid-weak base titrations?
Methyl orange would be suitable since it changes color in the acidic range.
Fantastic! Understanding this selection process is key for successful titration experiments.
Practical Application of Titration Curves
🔒 Unlock Audio Lesson
Sign up and enroll to listen to this audio lesson
In our last session, let's consider practical applications of titration curves. How can we apply what we've learned?
We can determine the concentration of an unknown solution!
Absolutely! By analyzing the titration curve, we can find the equivalence point and calculate the concentration. Can anyone describe why the curves can vary?
The type of acid and base used affects the shape and position of the curve, right?
Yes! This variability is crucial. So, when performing a titration, what steps should we remember to ensure accuracy?
Choosing the right indicator and carefully analyzing the curve for the equivalence point.
Exactly! Those are vital aspects of effective titration. Great work today everyone!
Introduction & Overview
Read summaries of the section's main ideas at different levels of detail.
Quick Overview
Standard
This section discusses the importance of titration curves as graphical tools that illustrate how the pH of a solution changes as a titrant is added. It highlights the significance of key features in the curves, such as the buffer region and equivalence point, and details how to choose appropriate acid-base indicators.
Detailed
Detailed Summary of Acid-Base Titration Curves and Indicators
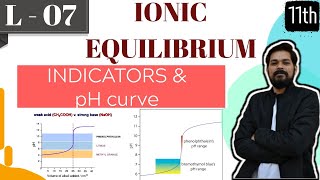
Titration curves depict the relationship between the volume of titrant added and the pH of the solution during the titration process. These curves are integral to visualizing pH changes, determining the equivalence point, selecting suitable acid-base indicators, and finding the pK_a or pK_b of weak acids or bases.
Key Features of Titration Curves:
- Initial pH: Represents the pH of the analyte solution before titrant addition, influenced by the strength and concentration of the analyte.
- Buffer Region: A flat segment where the pH changes gradually, indicating a buffering action, particularly notable at the half-equivalence point, where the pH equals the pK_a of the weak acid.
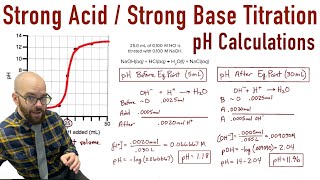
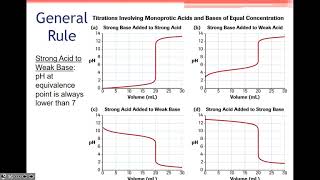
- Equivalence Point: The phase where the moles of titrant react completely with those of the analyte. It varies based on the nature of acid-base titrations (strong/weak, acid/base).
- Strong Acid - Strong Base: The equivalence point is at pH 7.0.
- Weak Acid - Strong Base: pH rises above 7.0.
- Strong Acid - Weak Base: pH falls below 7.0.
- Weak Acid - Weak Base: Equivalence points are less sharp, making them harder to determine.
- End Point: The indicator changes color, ideally coinciding with the equivalence point.
Acid-Base Indicators:
An acid-base indicator is generally a weak organic acid or base that displays different colors in acidic and basic environments. The color change occurs over a specified pH range, and the equilibrium shifts can be understood using the Henderson-Hasselbalch equation:
pH = pK_{In} + log10([ ext{HIn}]/[ ext{In}^-])
Choosing the correct indicator is critical; for example:
- For strong acid/strong base: Indicators such as phenolphthalein or methyl orange can be used.
- For weak acid/strong base: Phenolphthalein is preferred.
- For strong acid/weak base: Methyl orange is suitable.
Choosing the right indicator ensures that color change occurs at the equivalence point, thereby enhancing the accuracy of titration.
Youtube Videos


![Acid-Base Titrations & Titration Curves [IB Chemistry HL]](https://img.youtube.com/vi/WUS9TzTIPBE/mqdefault.jpg)

Audio Book
Dive deep into the subject with an immersive audiobook experience.
Introduction to Titration Curves
Chapter 1 of 4
🔒 Unlock Audio Chapter
Sign up and enroll to access the full audio experience
Chapter Content
Titration curves are graphical representations that illustrate the change in pH of a solution as a titrant (a solution of known concentration) is gradually added to an analyte (a solution of unknown concentration). These curves are invaluable for:
- Visualizing pH changes throughout a titration.
- Determining the equivalence point of the reaction.
- Selecting appropriate acid-base indicators.
- Determining the pK_a (or pK_b) of a weak acid (or base).
Detailed Explanation
Titration curves help us understand how the pH of a solution changes when we add an acid or a base to it. As we add the titrant (the solution we are using to neutralize another solution), the graph shows how the pH increases or decreases. This is essential for determining when the acid and base have reacted completely, a point called the equivalence point. Titration curves also guide us in choosing suitable indicators, substances that change color at a certain pH, and can help us find the strength of weak acids or bases.
Examples & Analogies
Imagine you are cooking, and you need to add salt to a big pot of soup. As you sprinkle in the salt, you taste the soup to see how the flavor changes. You might notice the soup becoming more salty until it reaches just the right balance, similar to how the pH changes in a titration curve, showing us when we have added just enough titrant.
Key Features of a Titration Curve
Chapter 2 of 4
🔒 Unlock Audio Chapter
Sign up and enroll to access the full audio experience
Chapter Content
Every titration curve has distinct features:
- Initial pH: The pH of the analyte solution before any titrant is added. This pH depends solely on the strength and initial concentration of the analyte.
- Buffer Region (for weak acid/base titrations): A relatively flat region on the curve where the pH changes slowly despite the addition of titrant. This is where the buffer system (created by the partial neutralization of the weak acid/base) is most effective.
- Equivalence Point (Stoichiometric Point): This is the crucial point in a titration where the moles of acid have precisely reacted with (or are stoichiometrically equivalent to) the moles of base.
- End Point: This is the point at which the chosen acid-base indicator changes colour.
Detailed Explanation
Titration curves are characterized by key features: Starting with the initial pH, which shows the acidity or basicity of the solution before any titrant is added. The buffer region is where pH changes slowly, allowing us to maintain a consistent pH when titrating weak acids or bases. The equivalence point, a critical moment in the titration, occurs when equal amounts of acid and base have reacted, producing an observable change. Finally, the endpoint represents the moment when an indicator shows a color change, signaling the completion of the reaction.
Examples & Analogies
Think of filling a bathtub. When you first turn on the taps, the water level starts low (initial pH). As you add hot water (titrant), the temperature changes slowly until the water turns warm and feels comfortable. This would represent the buffer area. The exact moment you switch off the tap at the perfect warm temperature (equivalence point) is when you have added just the right amount to feel great, similar to how we detect the endpoint with indicators.
Understanding Acid-Base Indicators
Chapter 3 of 4
🔒 Unlock Audio Chapter
Sign up and enroll to access the full audio experience
Chapter Content
An acid-base indicator is a weak organic acid or base that has distinctly different colours in its acidic (protonated) and basic (deprotonated) forms. The colour change occurs over a specific pH range, known as the indicator range. Let's represent a general indicator as a weak acid, HIn:
HIn (acidic colour)⇌H+(aq)+In−(aq) (basic colour)
The equilibrium constant for the indicator's dissociation is KIn. Applying the Henderson-Hasselbalch equation to the indicator:
pH=pKIn +log10 ([HIn][In−] )
Detailed Explanation
Indicators are special compounds that help us recognize the pH of a solution by changing color. They exist in two forms: an acidic form (HIn) and a basic form (In−). When we add an acid or a base, the balance between these forms changes, causing the color shift we observe. The Henderson-Hasselbalch equation lets us calculate the pH at which this color change occurs, helping us see when the pH of a solution is changing during a titration.
Examples & Analogies
Imagine a mood ring that changes color based on your feelings. Just like the mood ring responds to your emotional state, the indicator responds to changes in pH. When you add something sour (acid), the ring switches colors, alerting you that a change has happened, similar to how indicators signal the pH status through color changes.
Choosing the Right Indicator
Chapter 4 of 4
🔒 Unlock Audio Chapter
Sign up and enroll to access the full audio experience
Chapter Content
The most crucial criterion for selecting an indicator is that its pK_In value should lie within the steep vertical region (the pH jump) of the titration curve around the equivalence point. This ensures that the indicator changes colour precisely when the reaction reaches its stoichiometric completion.
Detailed Explanation
When selecting an indicator, it is essential that its sensitivity to pH changes aligns with the significant shift in the titration curve—referred to as the steep vertical region around the equivalence point. This is important because we want the color change to happen exactly when the acid is neutralized by the base, ensuring accurate results in our titration process.
Examples & Analogies
Think about picking the right alarm clock to wake up at sunrise. If you choose one that goes off too early or too late, you might miss the best moment to wake up! Similarly, if an indicator doesn't change color during the right moment of the titration, you could miss the equivalence point and won't know when the reaction is truly complete.
Key Concepts
-
Titration curves visualize pH changes, aiding in understanding acid-base reactions.
-
The equivalence point is where the moles of titrant equal the moles of analyte.
-
Indicators help determine the endpoint of titrations through color changes based on pH.
Examples & Applications
In a strong acid-strong base titration, the equivalence point typically occurs at pH 7.0.
For a weak acid titrated with a strong base, the equivalence point occurs at a pH greater than 7.0.
Memory Aids
Interactive tools to help you remember key concepts
Rhymes
In a titration, watch the flow, pH will change, this we know.
Stories
Once in a lab, a chemist named Max measured a solution's pH, carefully adding titrant to witness the color shift of his chosen indicator, celebrating at the equivalence point when all reacted perfectly.
Memory Tools
A-B-P-E: Assess Buffer, pinpoint Equivalence, then select the right indicator.
Acronyms
T.I.B.E. - Titration Initial pH, Buffer region, Equivalence point.
Flash Cards
Glossary
- Titration Curve
A graphical representation of pH changes during the titration process as a titrant is added to an analyte.
- Equivalence Point
The stage during a titration when the moles of titrant are stoichiometrically equivalent to the moles of analyte.
- Buffer Region
A segment in the titration curve where pH changes slowly as titrant is added, indicating a buffering action.
- AcidBase Indicator
A weak organic acid or base that changes color in response to pH changes in a solution.
- HalfEquivalence Point
The point in the titration curve where half of the weak acid has been neutralized and the pH equals the pK_a.
Reference links
Supplementary resources to enhance your learning experience.