
Aliasing in the Frequency Domain
Interactive Audio Lesson
Listen to a student-teacher conversation explaining the topic in a relatable way.
Understanding Aliasing
🔒 Unlock Audio Lesson
Sign up and enroll to listen to this audio lesson

Today, we are going to discuss a crucial concept in signal processing called aliasing. Aliasing happens when we sample a signal at a rate that is too low to accurately capture its high-frequency components. Can anyone tell me what sampling means?

Sampling is when you take specific measurements of a signal at regular intervals.
Exactly! Now, when we sample a signal, if the sampling rate is lower than twice the highest frequency present in the signal, we can get aliasing. Do you remember what the theorem is that relates these concepts?

That would be the Nyquist-Shannon sampling theorem!
Right! The Nyquist theorem tells us the sampling rate must be at least twice the maximum frequency of the signal. If the signal has higher frequency components, they can overlap with lower frequencies when sampled. Can anyone explain what happens during this overlap?

The high-frequency components could be misinterpreted as low-frequency components, which creates distortion.
Excellent explanation! This distortion is what we call aliasing.
Visualizing Aliasing
🔒 Unlock Audio Lesson
Sign up and enroll to listen to this audio lesson

To visualize aliasing, let's consider the spectrum of a continuous-time signal. When we sample this signal, the spectrum is repeated at intervals of the sampling frequency, f_s. Can anyone tell me what happens if our original signal has frequencies above the Nyquist frequency?

Those higher frequencies will fold back into the lower frequency range!
Correct! This folding back is what leads to aliasing. It’s important to be aware of this when processing signals. What methods can we use to prevent aliasing?
We can apply anti-aliasing filters before sampling to eliminate high-frequency components.
Exactly! Anti-aliasing filters are designed to reduce the risk of aliasing by removing frequencies above the Nyquist frequency. This is crucial for maintaining signal integrity.
Nyquist Frequency Review
🔒 Unlock Audio Lesson
Sign up and enroll to listen to this audio lesson
Let’s recap the Nyquist frequency. Can anyone explain what it is?
The Nyquist frequency is half the sampling rate, f_N = f_s / 2.
Perfect! And why is this frequency so important in avoiding aliasing?
If we sample a signal too slowly—below the Nyquist frequency—we can't accurately reconstruct the signal, leading to errors.
Yes! To summarize, always ensure your sampling rate is at least double the maximum frequency in your signal to avoid distortion. Remember this principle when working in signal processing!
Introduction & Overview
Read summaries of the section's main ideas at different levels of detail.
Quick Overview
Standard
This section explains the concept of aliasing in the frequency domain, how it arises from insufficient sampling, particularly when high-frequency components overlap with lower frequencies. It discusses the Nyquist frequency and emphasizes the necessity of avoiding frequencies higher than half the sampling rate to ensure accurate signal reconstruction.
Detailed
Aliasing in the Frequency Domain
Aliasing is an important phenomenon in signal processing that arises when the sampling rate of a continuous signal is insufficient to capture its high-frequency components. This section elaborates on how aliasing manifests in the frequency domain, where the overlapping of frequency components occurs due to inadequate sampling.
Key Points:
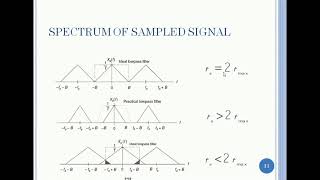
- Aliasing Explanation: When a signal is sampled, if its frequency components exceed half of the sampling rate (known as the Nyquist frequency), these high-frequency components can overlap with lower frequency components, creating distortion in the reconstructed signal.
- Nyquist Frequency: Defined as half of the sampling rate, the Nyquist frequency is crucial. To prevent aliasing, the maximum frequency present in the signal should be less than this frequency, ensuring the signal can be accurately reconstructed:
- If a signal has a maximum frequency of
f_max, the sampling ratef_smust satisfy the condition:f_s ≥ 2 * f_max.
- If a signal has a maximum frequency of
- Visualizing Aliasing: We can visualize aliasing through the relationship between the spectrum of a continuous-time signal and its discretized version after sampling. If these higher frequencies are sampled, they get folded back into the lower frequencies, resulting in incorrect representation.
This section underscores the essence of proper sampling strategies in signal processing to avoid irreversible loss of information in signal reconstruction.
Youtube Videos
Audio Book
Dive deep into the subject with an immersive audiobook experience.
Introduction to Aliasing
Chapter 1 of 3
🔒 Unlock Audio Chapter
Sign up and enroll to access the full audio experience
Chapter Content
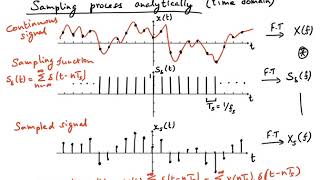
Aliasing occurs when the sampling rate is too low to capture the signal's high-frequency components. In the frequency domain, aliasing is manifested as the overlapping of frequency components due to insufficient sampling.
Detailed Explanation
Aliasing is a phenomenon that happens in signal processing when we do not sample a signal quickly enough to capture all of its important details. Each signal consists of various frequency components, and when we sample it at a low rate, we miss some high-frequency details. This leads to a situation where the higher frequency parts of the signal appear to blend in with the lower frequency parts, creating confusion and distortion when we try to reconstruct the original signal later.
Examples & Analogies
Imagine trying to watch a fast-moving object, like a racing car, through a camera that takes pictures only once every second. If the car moves too quickly between those snapshots, you might not capture its true path. Instead, you might think it’s moving much slower, or in a different direction entirely. Similarly, low sampling rates can misrepresent high-frequency signals.
Nyquist Frequency and Its Importance
Chapter 2 of 3
🔒 Unlock Audio Chapter
Sign up and enroll to access the full audio experience
Chapter Content
If a signal contains frequency components higher than half the sampling rate (the Nyquist frequency), these components will overlap with lower frequencies when sampled.
Detailed Explanation
The Nyquist frequency is a critical concept here—it is equal to half the sampling rate. For a signal to be accurately captured without aliasing, it must not contain frequency components that exceed this Nyquist frequency. If it does, when we sample the signal, these higher frequencies will 'fold' back down, blending into the lower frequency range, making them indistinguishable. This overlap creates aliasing, where once clear sounds or signals become mixed up and hard to decode.
Examples & Analogies
Think of a crowded room where people are talking. If you can only hear those who are speaking very softly, you might miss the louder conversations happening nearby. In the same way, if your signal contains fast, higher 'talking' frequencies but your sampling rate is set too low, those higher signals get caught up and misrepresented in the lower-frequency 'chatter.'
Visualizing Aliasing
Chapter 3 of 3
🔒 Unlock Audio Chapter
Sign up and enroll to access the full audio experience
Chapter Content
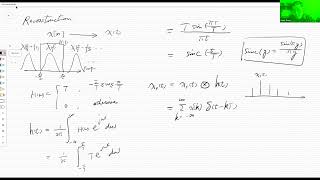
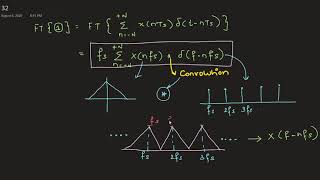
To visualize aliasing, consider the spectrum of a continuous-time signal X(f) and its corresponding discrete-time spectrum Xd(f) after sampling. When the signal is sampled at a frequency fs, the spectrum of the continuous signal repeats every fs Hz.
Detailed Explanation
When we plot the frequency spectrum of a signal, we can see where the frequency components lie. Sampling at a specific frequency 'fs' means that we effectively replicate this frequency spectrum at intervals of 'fs'. If there are frequencies in the original signal higher than 'fs/2', they will wrap around to lower frequencies due to this periodic replication, causing confusion in the representation. Visualizing this can help in understanding how high frequencies can become indistinguishable from low frequencies after sampling.
Examples & Analogies
Imagine a roller coaster that makes loops. If your friend only takes videos every second, they might miss some exciting twists and turns, leading them to think the ride is less thrilling than it actually is. Like your friend’s missed video moments, aliasing results from missing crucial high-frequency details in the signal.
Key Concepts
-
Aliasing: High-frequency components that cannot be accurately represented due to low sampling rates.
-
Nyquist Frequency: The maximum frequency that can be sampled without introducing aliasing.
-
Sampling Rate: The speed or frequency at which samples are taken from a signal.
Examples & Applications
If an audio signal contains a frequency of 1000 Hz but is sampled at 1200 Hz, aliasing may occur. If the sample rate is reduced, higher frequencies can overlap.
Consider a signal oscillating at 500 Hz sampled at 800 Hz; this may produce misleading lower frequencies in the sampled output.
Memory Aids
Interactive tools to help you remember key concepts
Rhymes
Aliasing occurs, when rates are low, High frequencies trick us, it’s hard to know!
Stories
Imagine a baker trying to make a layered cake. If she doesn't carefully layer the ingredients with enough space, the layers will blend, and the cake will not look or taste right. This is similar to how high-frequency signals blend when not sampled properly.
Memory Tools
Remember 'Nyquist' as in 'Never underestimate your quality in quantizing!' to recall the sampling principle.
Acronyms
HAP – High Frequencies Are Problematic in aliasing situations.
Flash Cards
Glossary
- Aliasing
A phenomenon that occurs when high-frequency signal components are indistinguishably represented as lower frequencies due to insufficient sampling.
- Nyquist Frequency
Half of the sampling rate; the maximum frequency that can be accurately represented without aliasing.
- Sampling Rate
The frequency at which continuous signals are sampled to create a discrete signal.
Reference links
Supplementary resources to enhance your learning experience.