
Isochron Mapping and Epicentral Distance
Enroll to start learning
You’ve not yet enrolled in this course. Please enroll for free to listen to audio lessons, classroom podcasts and take practice test.
Interactive Audio Lesson
Listen to a student-teacher conversation explaining the topic in a relatable way.
Introduction to Isochron Mapping
🔒 Unlock Audio Lesson
Sign up and enroll to listen to this audio lesson

Today, we're diving into isochron mapping. Can anyone tell me what you think isochrons are?

Are they related to measuring distances?
Great start! Isochrons are indeed related to mapping distances, but they specifically connect points where seismic waves arrive at the same time. This means they help us visualize how waves spread from an epicenter.

So, they're like circles on a map that show how far the waves traveled?
Exactly! They're often depicted as concentric lines. Remember this acronym, 'SAME' - Seismic waves Arrive, Mapping Extended. It helps us recall what isochrons do.

What do we use these isochrons for in real life?
Isochrons are used for analyzing seismic wave propagation, which helps in assessing earthquake impacts and planning responses.

Got it! So, they’re crucial for emergency planning too.
Yes, very important! In summary, isochrons help us visualize seismic wave arrivals and play a critical role in understanding earthquake effects.
Travel-Time Curves
🔒 Unlock Audio Lesson
Sign up and enroll to listen to this audio lesson

We talked about isochrons, now let’s move on to travel-time curves. Can anyone explain what they think travel-time curves are?
Are they charts showing how long waves take to get to certain points?
Exactly! Travel-time curves depict the time it takes for seismic waves to travel different distances. They are vital for estimating how far we are from the epicenter.
How do we use these curves in practice?
When we detect seismic waves, we compare the arrival times of P-waves and S-waves to use the travel-time curves for calculating the epicentral distance.
What happens if the waves take longer to arrive?
If waves take longer, it could mean that the distance from the epicenter is greater or that they’re passing through different geological layers that slow them down. It’s crucial for accurate readings!
That makes sense, so travel-time curves are like maps for how waves move through the ground?
Exactly! And to summarize, travel-time curves are fundamental for estimating epicentral distances and interpreting seismograms effectively.
Application of Isochron Mapping and Travel-Time Curves
🔒 Unlock Audio Lesson
Sign up and enroll to listen to this audio lesson
Now that we know about isochrons and travel-time curves, let's discuss their applications. Why do you think they're essential in seismology?
I think they help with predicting where earthquakes will hit hardest.
Correct! Isochron mapping and travel-time curves guide scientists to understand where seismic waves have the most impact. This helps in creating hazard maps.
So, they help in emergencies?
Absolutely! Quick and accurate information about wave travel helps responders plan efficiently. Remember the acronym 'PACE' - Predictive Analysis for Crisis Engagement.
Can this mapping help in building stronger structures?
Yes! Understanding where seismic waves are likely to be stronger allows engineers to design buildings that are more resilient to earthquakes.
That’s really important for safety!
Absolutely! To wrap up, isochron mapping and travel-time curves are not only fundamental in hazard assessment but also play a critical role in urban planning and disaster management.
Introduction & Overview
Read summaries of the section's main ideas at different levels of detail.
Quick Overview
Standard
In this section, we explore the concept of isochrons as crucial lines in understanding wavefront propagation. We delve into the significance of travel-time curves that assist in estimating the epicentral distance, reinforcing the importance of these methods in seismogram interpretation and seismic event analysis.
Detailed
Isochron Mapping and Epicentral Distance
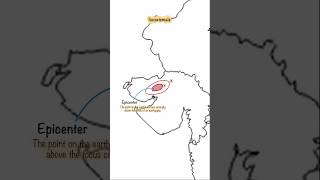
In seismology, isochrons are vital tools used to understand how seismic waves propagate from the epicenter of an earthquake. Isochrons are lines connecting points on a map that experience seismic waves at the same arrival time, creating a visual representation of wavefront propagation. These lines help scientists analyze and predict how seismic waves travel through different geological materials, which affects the waves' speed and intensity.
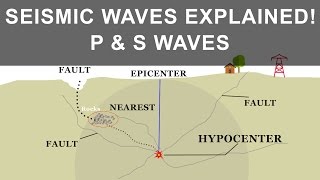
One essential aspect of using isochrons is their relationship with travel-time curves. These curves provide standardized data for different types of seismic waves, outlining their travel speeds and the time they take to reach seismic stations from an epicenter. By leveraging travel-time curves, seismologists can accurately estimate the distance from the epicenter to various observation points based on the difference in arrival times of the primary (P-waves) and secondary (S-waves) seismic waves. This methodology is not only fundamental for accurate epicenter determination but also critical for interpreting seismograms, which are records of ground motion during earthquakes.
Understanding isochron mapping enhances the accuracy of seismic hazard assessments and contributes to the effective planning and response strategies for earthquake mitigation.
Youtube Videos


Audio Book
Dive deep into the subject with an immersive audiobook experience.
Concept of Isochrons
Chapter 1 of 2
🔒 Unlock Audio Chapter
Sign up and enroll to access the full audio experience
Chapter Content
• Lines connecting points of equal seismic wave arrival time from the epicentre.
• Used to study wavefront propagation.
Detailed Explanation
Isochrons are lines that join various locations on the Earth's surface where seismic waves, generated by an earthquake, arrive simultaneously. When an earthquake occurs, it creates waves that travel outward from its epicentre. By mapping these arrival times, scientists can create contours that depict how far the waves have traveled. This information is vital as it illustrates how seismic energy propagates through the Earth, allowing researchers to visualize the spread of seismic energy over distance and time.
Examples & Analogies
Imagine throwing a stone into a pond. The waves that radiate out from the point where the stone hit the water can be seen as ripples. If you timed how long it took for each ripple to reach various points around the pond, you could draw lines connecting places where the ripples hit at the same time. Those lines would be similar to isochrons, showing how the ripples (or seismic waves) spread out from the initial disturbance (the earthquake).
Travel-Time Curves and Distance Estimation
Chapter 2 of 2
🔒 Unlock Audio Chapter
Sign up and enroll to access the full audio experience
Chapter Content
• Standardized curves for different wave types help estimate epicentral distance.
• Essential for seismogram interpretation.
Detailed Explanation
Travel-time curves are graphs that plot the time it takes for different types of seismic waves (like P-waves and S-waves) to travel from the earthquake focus to various points on the surface. Each type of wave travels at its own speed, which is influenced by the material it moves through. By using these curves, seismologists can estimate how far the waves traveled based on the time they recorded each wave's arrival. This distance helps pinpoint the location of the epicentre of the earthquake, which is crucial for assessing potential damage and planning emergency responses.
Examples & Analogies
Consider a race between two friends—one is running and the other is riding a bicycle. If you know when each friend starts and when they reach certain points, you can estimate how far they have traveled based on their speed. Each friend's travel time forms a curve on a graph. Similarly, in seismology, by measuring how long it takes for different seismic waves to arrive, scientists can determine how far the earthquake's epicentre is, based on travel-time curves.
Key Concepts
-
Isochron Mapping: Understanding the visual representation of seismic wave propagation.
-
Travel-Time Curves: Essential for estimating distances from the epicenter based on wave arrival times.
Examples & Applications
An example of isochron mapping can be seen in earthquake hazard maps, which indicate expected severity of shaking across regions.
Travel-time curves can show the difference in times between P-wave and S-wave arrivals at various distances from an earthquake epicenter.
Memory Aids
Interactive tools to help you remember key concepts
Rhymes
Isochron lines draw a curve, each point equal, that’s the nerve!
Stories
Imagine a race where waves travel outward from a starting point; isochrons help mark where all participants arrive at the same second—showing the distance traveled.
Memory Tools
For waves' travel time, remember 'P.S. It's Distance!' - P-waves arrive first and signify seismic distances and their propagation.
Acronyms
'MAP' helps you remember
'Mapping Arrival Propagation' for isochron mapping.
Flash Cards
Glossary
- Isochrons
Lines connecting points of equal seismic wave arrival time from the epicenter.
- TravelTime Curves
Standardized curves depicting the time it takes for different seismic waves to travel from the epicenter to various points.
Reference links
Supplementary resources to enhance your learning experience.