
Hypocentre Mapping in Tectonic Studies
Enroll to start learning
You’ve not yet enrolled in this course. Please enroll for free to listen to audio lessons, classroom podcasts and take practice test.
Interactive Audio Lesson
Listen to a student-teacher conversation explaining the topic in a relatable way.
Introduction to Hypocentre Mapping
🔒 Unlock Audio Lesson
Sign up and enroll to listen to this audio lesson

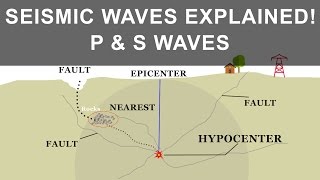
Welcome everyone! Today, we'll explore the significance of hypocentre mapping in tectonic studies. Can anyone tell me what a hypocentre is?

Isn’t it the point inside the Earth where an earthquake starts?
Exactly! The hypocentre is critical in locating earthquakes. Now, why do you think mapping these hypocentres is important?

Maybe to see where earthquakes happen frequently?
Yes! Mapping helps identify active faults and understand tectonic processes. One key aspect is seismic zoning, which relies on hypocentre clusters.

How do these zones help us?
Great question! Urban planning and the location of important facilities like dams and nuclear plants depend on this data. Remember, zoning can mitigate risks! Let’s recap: Hypocentre mapping helps identify faults, define zones, and supports safety in design.
Applications of Hypocentre Clusters
🔒 Unlock Audio Lesson
Sign up and enroll to listen to this audio lesson

Now, let’s look at some specific applications of hypocentre clusters. Student_4, can you give an example where this might be applied?

Maybe in building houses in an earthquake-prone area?
Exactly! When you know where earthquakes are likely, you can plan safer buildings. What about other areas like nuclear facilities?
Those need to be placed very carefully since they can't handle much shaking.
That’s right! We use hypocentre data for siting these facilities too. Understanding fault systems helps us create safer environments. For visual learners: think of hypocentres as the dots on a map that show us where to avoid building.
How exact are these mappings?
Good point! Advances in technology have improved our accuracy. To summarize, hypocentre clustering is crucial for urban planning and safety.
3D Fault Imaging
🔒 Unlock Audio Lesson
Sign up and enroll to listen to this audio lesson
Let’s dive into 3D fault imaging. What do you think this involves, Student_3?
Does it help us see what’s below the surface?
Absolutely! 3D imaging relies on hypocentre distributions. This gives us a clearer picture of faults, including characteristics like dip and fracture systems. How might this knowledge benefit us?
It could help engineers build better structures since they can see what's going on underground.
Correct! Visualizing subsurface structures leads to safer civil engineering practices. Remember the importance of understanding fault interfaces in areas like subduction zones.
So the more we understand the faults, the better we can design against earthquakes!
Exactly! To summarize, 3D fault imaging using hypocentre data helps us visualize complex underground systems, leading to better safety measures.
Introduction & Overview
Read summaries of the section's main ideas at different levels of detail.
Quick Overview
Standard
This section discusses how mapping hypocentres over time aids in defining seismic zones and understanding tectonic boundaries. It emphasizes the importance of hypocentre clustering for urban planning and fault imaging.
Detailed
Hypocentre Mapping in Tectonic Studies
Mapping hypocentres plays a crucial role in tectonic studies, allowing geoscientists to identify active faults and define tectonic boundaries over time. Understanding where these hypocentres cluster is vital for various applications in urban planning, dam site selection, and siting of nuclear facilities. Additionally, 3D fault imaging using hypocentre distributions offers insights into the characteristics of fault dips, subsurface fracture systems, and megathrust interfaces found in subduction zones. This comprehensive approach aids in enhancing our understanding of earthquake mechanics and improving safety measures in earthquake-prone regions.
Youtube Videos


Audio Book
Dive deep into the subject with an immersive audiobook experience.
Seismic Zoning
Chapter 1 of 2
🔒 Unlock Audio Chapter
Sign up and enroll to access the full audio experience
Chapter Content
• Hypocentre clusters used to define seismic zones and seismotectonic provinces
• Useful in:
– Urban planning
– Dam site selection
– Nuclear facility siting
Detailed Explanation
Seismic zoning is the process of categorizing regions based on their susceptibility to earthquakes. By mapping clusters of hypocentres, researchers can identify areas that are more likely to experience significant seismic activity. This information is crucial for urban planning, where it helps determine where to build homes and infrastructure safely. For example, areas with frequent seismic activity may require stricter building codes or might be avoided altogether for certain constructions, such as nuclear facilities or dams, which need stable ground to ensure safety and functionality.
Examples & Analogies
Think of seismic zoning like designing a playground for children. If a playground is built on unstable ground, it may collapse when kids run and play. Similarly, buildings and facilities must be placed on solid ground to withstand earthquakes. The study of hypocentre locations helps planners find 'playgrounds' – or construction sites – that are safe and secure.
3D Fault Imaging
Chapter 2 of 2
🔒 Unlock Audio Chapter
Sign up and enroll to access the full audio experience
Chapter Content
• Hypocentre distributions give insights into:
– Fault dips
– Subsurface fracture systems
– Megathrust interfaces in subduction zones
Detailed Explanation
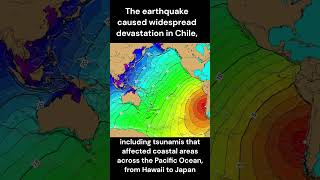
The distribution of hypocentres provides valuable information about the geometry and behavior of faults underground. Analyzing these clusters helps scientists visualize fault dips, which refer to the angle at which a fault plane is inclined. Understanding the subsurface fracture systems is essential because these can determine how stress is distributed in the Earth's lithosphere. Additionally, for subduction zones, where one tectonic plate moves under another, identifying megathrust interfaces through hypocentre distribution is critical for evaluating earthquake risks and potential tsunami generation.
Examples & Analogies
Imagine you're exploring an underground cave system filled with twists and turns. By mapping where you've seen rocks shift (similar to hypocentres), you can paint a picture of how deep and how steep the cave gets. This knowledge can save you from getting lost or facing unstable areas. Just like in earth science, understanding the structure of faults helps predict where problems may arise, allowing for better planning and risk management.
Key Concepts
-
Hypocentre: The starting point of an earthquake that is critical for mapping seismic events.
-
Seismic Zoning: Dividing areas based on their earthquake risk to enhance safety.
-
3D Fault Imaging: Utilizing hypocentre data to visualize underground fault systems.
Examples & Applications
Urban planning uses hypocentre data to decide where buildings should be located.
Nuclear facilities are sited away from known active faults identified through hypocenter clusters.
Memory Aids
Interactive tools to help you remember key concepts
Rhymes
Mapping down deep, keep safety in mind,
Stories
Once upon a time, geoscientists mapped the Earth’s depths to find seismic secrets. With hypocentres, they unearthed the unseen, safeguarding cities from nature’s fury.
Memory Tools
H - Hypocentre
Acronyms
HIZ = Hypocentre, Imaging, Zones - remembering mapping’s core aspects!
Flash Cards
Glossary
- Hypocentre
The exact point within the Earth where an earthquake rupture initiates.
- Seismic Zoning
The practice of defining areas in terms of their earthquake risk based on historical seismic data.
- 3D Fault Imaging
The process of creating three-dimensional visualizations of fault lines and subsurface structures using seismic data.
Reference links
Supplementary resources to enhance your learning experience.