
Techniques to Determine Hypocentre Location
Enroll to start learning
You’ve not yet enrolled in this course. Please enroll for free to listen to audio lessons, classroom podcasts and take practice test.
Interactive Audio Lesson
Listen to a student-teacher conversation explaining the topic in a relatable way.
Triangulation Using P- and S-Waves
🔒 Unlock Audio Lesson
Sign up and enroll to listen to this audio lesson

To determine the hypocentre, one commonly used method is triangulation. Can anyone explain what this involves?

I think it has to do with measuring the time it takes for P-waves and S-waves to arrive at different stations.
Exactly! We measure the time lag between the arrival of P-waves and S-waves at multiple seismic stations. This allows us to draw circles on a map, where the centers of these circles represent the potential locations of the hypocentre.

And when the circles intersect, that gives us the epicentre, right?
Yes! This method mainly helps us find the epicentre, and we can calculate the depth to identify the hypocentre. Remember, the P-waves travel faster, and they give us early warnings.

Can we summarize this with a mnemonic, like 'PEWS' for P-wave, Earthquake, Waves, and Station?
Great idea! 'PEWS' can help us remember the components involved in triangulation. So, what are the key steps again?

Measure P and S wave arrival times, draw circles for locations, find intersections!
Perfect! Always apply this method when assessing earthquake impact.
Seismic Tomography
🔒 Unlock Audio Lesson
Sign up and enroll to listen to this audio lesson

Now let’s move on to seismic tomography. Who can tell me why this method is significant?
It uses seismic waves to visualize the Earth's interior, right?
Exactly. Seismic tomography allows us to create 3D images of subsurface structures. This helps in accurately locating hypocentres and understanding how seismic waves travel through different materials.
So it's like an X-ray for the Earth?
Exactly! We analyze the way seismic waves travel through the Earth and can identify variations in velocity, which can indicate different materials or structures. How does this improve our analyses?
It helps in determining the best sites for structures, ensuring they're built in safer areas!
Yes! This technique enhances our ability to assess risks and make informed decisions in engineering.
Inversion Techniques
🔒 Unlock Audio Lesson
Sign up and enroll to listen to this audio lesson
Finally, let’s discuss inversion techniques. Why do we use them in earthquake analysis?
They help fit observed data to theoretical models for accurate estimation, right?
Correct! Inversion techniques use mathematical models to correlate seismic data, like arrival times, with expected behaviors, helping us refine our hypocentre estimates.
So, it’s about matching what we see with what we expect?
Absolutely. This process can yield critical information on location, depth, and fault characteristics. It enhances our predictive capabilities.
Could we do a quick recap using 'DRE' for Depth, Refinement, and Estimation?
Fantastic mnemonic! Remember DRE as it encapsulates the essential elements of inversion techniques.
Inversion makes sense for better safety and design.
Well done! Let’s ensure we utilize these techniques to improve our earthquake safety measures.
Introduction & Overview
Read summaries of the section's main ideas at different levels of detail.
Quick Overview
Standard
In this section, we explore the key methodologies employed in locating the hypocentre of seismic events. The techniques include triangulation based on P- and S-wave timings, seismic tomography for creating 3D images of subsurface structures, and inversion techniques that use mathematical models to match observed and theoretical data for accurate hypocentre estimation.
Detailed
Techniques to Determine Hypocentre Location
Understanding the hypocentre's location is crucial in earthquake engineering, as it impacts seismic wave propagation and hazard assessment. The section discusses three primary techniques for determining the hypocentre:
1. Triangulation Using P- and S-Waves
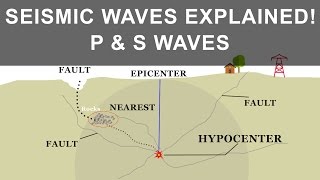
This method measures the time difference between the arrival of Primary (P) waves and Secondary (S) waves at different seismic stations. By plotting circles of possible hypocentre locations based on arrival times, intersections reveal the epicentre, with depth estimates leading to accurate hypocentre determination.
2. Seismic Tomography
Seismic tomography enhances the precision of hypocentre location by utilizing seismic wave data to generate comprehensive 3D images of the Earth's interior. This technique helps in understanding subsurface structures, which can impact seismic behavior and damage assessment.
3. Inversion Techniques
Using mathematical models, inversion techniques correlate observed seismic data (like arrival times) with theoretical predictions. This approach provides refined estimates of hypocentral locations, depths, and fault plane characteristics.
The successful implementation of these techniques is critical for timely earthquake response and effective civil engineering practices.
Youtube Videos


Audio Book
Dive deep into the subject with an immersive audiobook experience.
Triangulation Using P- and S-Waves
Chapter 1 of 3
🔒 Unlock Audio Chapter
Sign up and enroll to access the full audio experience
Chapter Content
• By measuring the time lag between P- and S-waves at various seismograph stations.
• Circles of possible locations are drawn on a map from each station, and the intersection gives the epicentre. Depth calculations help determine the hypocentre.
Detailed Explanation
Triangulation is a method used to find the exact location of the hypocentre, the point within the Earth where an earthquake begins. This technique relies on the time difference between P-waves and S-waves, two types of seismic waves generated during an earthquake. The P-waves travel faster than S-waves, so the time lag between their arrivals at different seismograph stations can be measured.
- Collect Data: First, seismologists set up multiple seismograph stations that can detect these waves.
- Calculate Distances: By measuring the time difference between the arrivals of the P-wave and the S-wave at each station, the distance to the hypocentre can be estimated.
- Draw Circles: Seismologists then draw circles on a map around each station, with each circle representing the possible location of the hypocentre based on the calculated distances.
- Find Intersection: The point where all these circles intersect gives the epicentre of the earthquake. Further calculations considering the depth of the seismic event allow them to pinpoint the exact hypocentre below the surface.
Examples & Analogies
Imagine you're trying to find a hidden treasure in a park with your friends. Each of you stands at a different spot and shouts the distance to the treasure when you hear a bell ring. If one of your friends is close and shouts first, you can start drawing circles from each position based on how far away everyone is claiming the treasure is. Where those circles intersect is where the treasure is buried, and you can dig deeper to find it!
Seismic Tomography
Chapter 2 of 3
🔒 Unlock Audio Chapter
Sign up and enroll to access the full audio experience
Chapter Content
• Uses seismic waves to create 3D images of Earth's interior.
• Enhances precision in locating hypocentres and understanding subsurface structures.
Detailed Explanation
Seismic tomography is a technique that takes advantage of the seismic waves generated by earthquakes to create a detailed 3D image of the Earth's interior. Here's how it works:
- Collect Seismic Data: When an earthquake occurs, seismic waves travel through the Earth. Multiple seismometers record these waves at various locations.
- Analyze Speed Variations: The speed of these waves can change depending on the materials they pass through. For example, they travel faster through solid rock than through liquid or softer materials. By analyzing how fast the waves arrive at different stations, scientists can infer the composition and structure of the Earth's interior.
- Create 3D Images: Using sophisticated algorithms, the collected data allows scientists to construct three-dimensional images of what lies beneath the Earth’s surface, revealing details about the location of the hypocentre as well as other geological features.
Examples & Analogies
Think of seismic tomography like using ultrasound imaging to view a baby's development in the womb. Just as ultrasound waves help create a picture of the baby's position and surroundings, seismic waves provide a glimpse into the Earth's interior, helping geologists visualize what’s beneath our feet.
Inversion Techniques
Chapter 3 of 3
🔒 Unlock Audio Chapter
Sign up and enroll to access the full audio experience
Chapter Content
• Mathematical models are used to fit observed data (arrival times) with theoretical models.
• Results in estimates of location, depth, and fault plane parameters.
Detailed Explanation
Inversion techniques are mathematical approaches used to refine the estimates of the hypocentre's location and depth by comparing observed seismic data to theoretical models. Here’s how this works:
- Gather Data: Seismologists first collect data about when seismic waves arrive at various stations following an earthquake.
- Theoretical Models: They then use established mathematical models that predict how these waves should travel through the Earth.
- Fit the Models: The inversion process adjusts the parameters of the theoretical models—such as the potential location and depth of the hypocentre—to best fit the observed data from the seismic stations.
- Estimate Parameters: By doing this, scientists can obtain more precise estimates of the hypocentre’s location, its depth, and characteristics of the fault plane, which is crucial for understanding the earthquake's behavior.
Examples & Analogies
Imagine trying to tune a musical instrument by ear. You play a note and listen carefully to see how close the pitch is to the desired note. If it's off, you adjust the strings slightly until they match perfectly. In inversion techniques, scientists do something similar: they 'tune' their models based on the data they observe to get the most accurate picture possible of the earthquake's hypocentre.
Key Concepts
-
Triangulation: A method to pinpoint earthquake hypocentre via time differences between seismic wave arrivals.
-
Seismic Tomography: Technique for visualizing Earth's interior using seismic data to improve hypocentre location accuracy.
-
Inversion Techniques: Methodologies that mathematically model seismic data to refine hypocentre estimations.
Examples & Applications
Using triangulation, if a P-wave arrives at Station A at 10 seconds and at Station B at 12 seconds, and the S-wave arrives at Station A at 20 seconds and Station B at 22 seconds, the time difference gives an intersection point on a map.
In seismic tomography, the analysis of wave speeds allows engineers to visualize and better understand underground fault lines, leading to safer construction in earthquake-prone areas.
Memory Aids
Interactive tools to help you remember key concepts
Rhymes
To find the waves that shake the ground, Triangulate to find them round.
Stories
Imagine an earthquake detective using triangulation to find the source of tremors. They gather clues from different points (stations) and find where the clues intersect—this is where the earthquake starts, the hypocentre!
Memory Tools
For P-waves and S-waves: 'P starts first, then S brings the stir!'
Acronyms
TIS for Triangulation, Inversion, and Seismic Tomography!
Flash Cards
Glossary
- Hypocentre
The point inside the Earth where the earthquake rupture begins; also known as focus.
- Epicentre
The surface projection of the hypocentre directly above it.
- Triangulation
A method for determining the location of an earthquake's hypocentre using time differences of seismic waves.
- Seismic Tomography
A technique that uses seismic waves to create 3D images of the Earth's interior.
- Inversion Techniques
Mathematical modeling processes that fit observed seismic data to theoretical models to accurately estimate hypocentre parameters.
Reference links
Supplementary resources to enhance your learning experience.