
Isoseismal Maps and Their Interpretation
Enroll to start learning
You’ve not yet enrolled in this course. Please enroll for free to listen to audio lessons, classroom podcasts and take practice test.
Interactive Audio Lesson
Listen to a student-teacher conversation explaining the topic in a relatable way.
Introduction to Isoseismal Lines
🔒 Unlock Audio Lesson
Sign up and enroll to listen to this audio lesson

Today we'll discuss isoseismal lines, which are contour lines connecting places that felt the same seismic intensity during an earthquake. Can anyone tell me why this might be important?

They could help us understand where the shaking was strongest.
Exactly! By visualizing seismic intensity, we can assess damage patterns. This also aids in locating the epicenter. Remember, intensity affects not just buildings but also people.

So, how does that help with insurance and planning?
Great question! Isoseismal maps are essential for loss estimation in insurance and for improving urban planning. They guide how resources are allocated in emergencies.

I see! It’s like mapping out a problem to solve it more effectively.
Exactly! Mapping is key for effective response and structural planning. Let's remember: **ISO**seismal points for **ISO**lated seismic data!

That’s a catchy way to remember it!
Uses of Isoseismal Maps
🔒 Unlock Audio Lesson
Sign up and enroll to listen to this audio lesson

Now let's explore the various uses of isoseismal maps. Can anyone think of a scenario where knowing the intensity distribution could be critical?
It might help locate where most damage occurred after an earthquake.
Correct! These maps help identify anomalies in ground responses, which can be crucial for engineers assessing damage. Additionally, they are key in seismic microzonation.
What exactly is seismic microzonation?
Seismic microzonation involves analyzing how local ground conditions influence seismic effects. Isoseismal maps help in this analysis by showing areas of different intensity. Remember, **M**icrozoning **I**dentifies **R**isks!
So, the maps can help direct where to build more carefully?
Absolutely! They guide site-specific design to avoid future damage. Let's summarize: isoseismal maps are pivotal for assessing damage, planning responses, and enhancing construction strategies.
Interpreting Isoseismal Maps
🔒 Unlock Audio Lesson
Sign up and enroll to listen to this audio lesson
Let's dive into how we interpret these maps. Supposing you see isoseismal lines that are closely spaced, what would that indicate?
That the shaking was very strong and rapid in that area?
Exactly! Close lines indicate a rapid change in shaking intensity. Conversely, widely spaced lines suggest more uniform shaking. Always consider local geological conditions, too!
Local conditions can change how strong the shaking feels?
Yes! For example, soft soils can amplify shaking intensity. Remember: **C**lose lines mean **C**onsiderable changes! Keep analyzing how different factors affect maps.
This is really helpful for understanding risk.
Exactly! To recap, isoseismal maps are fundamental for interpreting earthquake effects, especially regarding ground response variability.
Introduction & Overview
Read summaries of the section's main ideas at different levels of detail.
Quick Overview
Standard
Isoseismal maps depict contours of equal seismic intensity post-earthquake, aiding in identifying epicenters and assessing ground response. They play key roles in seismic microzonation, insurance, and validating models of ground motion.
Detailed
Isoseismal Maps and Their Interpretation
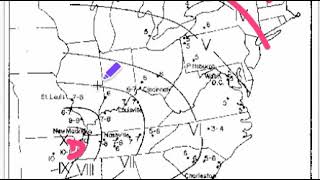
Isoseismal maps are tools used to represent the distribution of seismic intensity across a region following an earthquake. They consist of contour lines called isoseismal lines, which connect points that experienced the same level of shaking. The primary uses of these maps include identifying the epicenter of an earthquake, detecting areas with unusual ground responses, and supporting seismic microzonation efforts. Furthermore, they are valuable for estimating financial losses in insurance contexts and for validating ground motion attenuation models. Understanding isoseismal maps can greatly enhance emergency response and urban planning strategies, making them integral to earthquake engineering and disaster preparedness.
Youtube Videos


Audio Book
Dive deep into the subject with an immersive audiobook experience.
Isoseismal Lines
Chapter 1 of 2
🔒 Unlock Audio Chapter
Sign up and enroll to access the full audio experience
Chapter Content
• Contour lines joining locations of equal seismic intensity.
• Used to visualize the distribution of shaking across a region after an earthquake.
Detailed Explanation
Isoseismal lines are like contour lines on a map that connect points where the seismic intensity is the same. After an earthquake, scientists create these lines to understand how different areas experienced shaking. The lines help identify regions that felt a stronger or weaker impact, showing the way the earthquake's effects spread out from its center.
Examples & Analogies
Imagine a still pond. If you throw a stone into the water, it creates ripples. The closer you are to where the stone fell, the larger the ripples you feel. Isoseismal lines work similarly, showing how the 'ripples' of an earthquake affect different areas, with the strongest shaking near the epicenter and weaker shaking farther away.
Uses of Isoseismal Maps
Chapter 2 of 2
🔒 Unlock Audio Chapter
Sign up and enroll to access the full audio experience
Chapter Content
• Help in identifying:
– Epicenter location
– Areas with anomalous ground response
• Useful in:
– Seismic microzonation
– Insurance and loss estimation
– Validation of attenuation models
Detailed Explanation
Isoseismal maps serve several important purposes. They help scientists pinpoint where an earthquake’s epicenter is located based on the intensity of shaking reported across different areas. They can also reveal unexpected ground behavior in certain regions, which is critical for understanding local geology. Additionally, these maps support seismic microzonation, helping to create safer building codes by identifying areas most likely to experience intense shaking. Insurance companies can use this data for evaluating potential losses and validating models that predict how ground motion decreases with distance from the epicenter.
Examples & Analogies
Think about organizing a sports event in a park. If a storm hits, some areas may flood more than others due to drainage differences. An isoheismal map is like a flood risk map: it shows which areas are at greater risk of severe damage. Just as event organizers must plan for potential flooding by knowing where it might be worst, urban planners and engineers use isoseismal maps to prepare for earthquakes.
Key Concepts
-
Isoseismal Maps: Visual representations of seismic intensity distributions after an earthquake.
-
Epicenter Location: Isoseismal maps assist in identifying where the earthquake's effects were strongest.
-
Ground Response Variability: The influence of geological factors on how strongly shaking is felt across different areas.
Examples & Applications
After the 2010 Haiti earthquake, isoseismal maps were used to estimate the need for relief resources based on intensity distributions.
In Japan, isoseismal maps informed the retrofitting of buildings in regions identified as having higher seismic risk.
Memory Aids
Interactive tools to help you remember key concepts
Rhymes
Isoseismal lines align, showing intensity just fine!
Stories
Imagine an artist painting the effects of an earthquake; they use shades to show different intensities, forming lines that reveal how the earth reacted in each place, just like isoseismal maps.
Memory Tools
I.S.O. - Intensity Surfaces Overlaid: Think of the overlay of intensity contours that create isoseismal maps.
Acronyms
E.R.A. - Epicenter, Response, Assessment; components of the significance of isoseismal maps.
Flash Cards
Glossary
- Isoseismal Lines
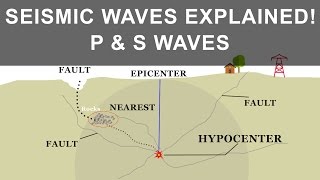
Contour lines connecting locations of equal seismic intensity during an earthquake.
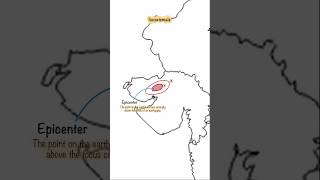
- Epicenter
The point on the Earth's surface directly above the earthquake's origin.
- Seismic Microzonation
The process of analyzing local ground conditions to understand varying seismic risks.
- Ground Response
The reaction of the ground to seismic waves, influenced by local geological conditions.
Reference links
Supplementary resources to enhance your learning experience.