
Basics of Cartography
Enroll to start learning
You’ve not yet enrolled in this course. Please enroll for free to listen to audio lessons, classroom podcasts and take practice test.
Interactive Audio Lesson
Listen to a student-teacher conversation explaining the topic in a relatable way.
Definition and Scope of Cartography
🔒 Unlock Audio Lesson
Sign up and enroll to listen to this audio lesson

Today, we’re going to learn about cartography, which is essentially the art and science of map-making. Can anyone tell me what they think it covers?

It must involve creating maps, right?
Exactly! Cartography involves conception, production, dissemination, and study of maps. It's more than just drawing; it includes understanding both topographic and thematic maps.

What do you mean by thematic maps?
Great question! Thematic maps focus on specific themes like population density or land use, rather than just showing physical features.

So thematic maps help us understand various patterns and distributions?
Absolutely! Remember, the acronym **CATS** can help you remember: **C**onception, **A**rt, **T**opographic, and **S**ematic. Let's move on to map components.
Components of a Map
🔒 Unlock Audio Lesson
Sign up and enroll to listen to this audio lesson

Every map has certain standard components. Can anyone name a few?

I know the title is important.
Exactly! Other key components include the legend, which explains symbols, and scale, which relates the map distance to real-world measurements.
How about the north arrow?
Correct! The north arrow indicates orientation. Remember the acronym **LEGEND** for the essential components: **L**egend, **E**ast (North arrow), **G**rid, **E**xplanation (Source), **N**ame (Title), and **D**ate. Now let's discuss the importance of map scales.
Map Scales
🔒 Unlock Audio Lesson
Sign up and enroll to listen to this audio lesson
Map scales can be classified into large, medium, and small scales. Who can tell me what makes a large-scale map?
It shows more detail but covers a smaller area?
Correct! For example, a 1:10,000 scale shows a lot of detail of a small area. What about small scale?
That would show less detail but cover a broader area!
Yes! Remember the phrase **Big Maps = Lots of Details** for large scales. Now let’s proceed to map projections.
Map Projections
🔒 Unlock Audio Lesson
Sign up and enroll to listen to this audio lesson
Moving on to map projections, can anyone explain why they are important?
They help us transform the 3D Earth into a 2D map?
Right! They minimize distortion. There are different types like conformal, equal area, and compromise. Remember the slogan: **MAP IS** - **M**ercator for conformal, **A**rea for equal, and **P**roportional for compromise.
So each projection has pros and cons?
Exactly! It’s all about what you need your map to represent. Let's not forget about proper symbolization in maps.
Symbolization
🔒 Unlock Audio Lesson
Sign up and enroll to listen to this audio lesson
Finally, let’s discuss symbolization. What methods do we use to represent features on maps?
We can use points, lines, and polygons!
Exactly! And how do we differentiate features?
Using size, shape, color, and patterns?
Well done! Remember **SCP** for Size, Color, and Pattern. It’s essential to convey the right message visually when we create maps!
Introduction & Overview
Read summaries of the section's main ideas at different levels of detail.
Quick Overview
Standard
This section details the fundamental aspects of cartography, including its definition, standard components of maps, different scales, map projections, and symbolization. Understanding these basics is crucial for effective map-making and thematic mapping.
Detailed
Basics of Cartography
Cartography is defined as both a science and an art focused on the conception, production, dissemination, and study of maps. The discipline spans both topographic maps, which depict physical and man-made features, and thematic maps that highlight specific themes such as population density and land use. This section emphasizes key components every map should have:
- Title: Indicates the map's subject.
- Legend: Provides meanings for symbols and colors used.
- Scale: Shows the relationship between distance on the map and real-world distance, presented as a ratio (e.g., 1:50,000)
- North Arrow: Aids in orientation.
- Grid or Graticule: Displays latitude-longitude or UTM grid for spatial reference.
- Source and Date: Reflects data origin and relevance.
The importance of map scales is explained, distinguishing between large-scale maps (high detail for small areas), medium-scale maps (balanced detail and area), and small-scale maps (less detail, wider geographic coverage). Furthermore, the section introduces map projections, which transform the Earth's 3D surface onto 2D maps with types that preserve angles, areas, or distances, including common projections like Mercator for conformal, Mollweide for equal area, and Robinson for compromise.
Additionally, symbolization techniques are discussed, particularly how components like size, shape, color, and patterns convey different geographic information. Understanding these basic principles of cartography is fundamental for anyone involved in creating or interpreting maps.
Youtube Videos


Audio Book
Dive deep into the subject with an immersive audiobook experience.
Definition and Scope of Cartography
Chapter 1 of 5
🔒 Unlock Audio Chapter
Sign up and enroll to access the full audio experience
Chapter Content
- Cartography is the discipline dealing with the conception, production, dissemination, and study of maps.
- Encompasses both topographic and thematic maps.
- Involves understanding scale, projections, symbology, generalization, and aesthetics.
Detailed Explanation
Cartography is not just about creating maps; it includes the entire process of planning, producing, sharing, and analyzing maps. It covers different types of maps, including topographic maps, which show physical features of the Earth, and thematic maps that focus on specific themes or data points, such as population or land use. Cartographers must also consider various technical aspects like scale (how distances are represented), projections (how the curved surface of the Earth is represented on a flat map), and the use of symbols to depict information correctly.
Examples & Analogies
Think of cartography as cooking: you need a recipe (definition and scope) to know how to combine different ingredients (topographic and thematic maps) in the right way (scale, projections, symbology) to make a delicious dish (a functional map).
Components of a Map
Chapter 2 of 5
🔒 Unlock Audio Chapter
Sign up and enroll to access the full audio experience
Chapter Content
- Title: Indicates the subject of the map.
- Legend: Explains the meaning of symbols and colors.
- Scale: Expressed as representative fraction (e.g., 1:50,000).
- North Arrow: Shows orientation.
- Grid or Graticule: Latitude-longitude or UTM grid for spatial reference.
- Source and Date: Indicates data origin and relevance.
Detailed Explanation
Every map contains essential components that help users understand the information being presented. The title gives the map its identity, while the legend provides explanations for the symbols and colors used. The scale allows users to interpret real-life distances based on the measurements on the map. The north arrow indicates directions, helping users orient themselves. A grid or graticule helps in providing spatial reference points, and the source and date give credibility to the map’s information.
Examples & Analogies
Imagine you receive a gift (the map) but don’t know what it is without a card (the title). The card tells you the purpose of the gift (subject). The instructions provided (legend) help you use it correctly. The scale is like a measuring tape that shows you how big or small things are in your gift, while the orientation on the box ensures you know which way is up!
Map Scales
Chapter 3 of 5
🔒 Unlock Audio Chapter
Sign up and enroll to access the full audio experience
Chapter Content
- Large Scale Maps (e.g., 1:10,000): More detail, smaller area.
- Medium Scale Maps (e.g., 1:50,000): Balanced detail and coverage.
- Small Scale Maps (e.g., 1:250,000): Less detail, broader area.
Detailed Explanation
Map scale is crucial because it indicates how much detail is provided for a given area on the map. Large-scale maps show a smaller area with great detail, useful for things like city planning or hiking trails. Medium-scale maps provide a balance, often used for regional planning or maps for travelers. Small-scale maps cover large areas with less detail, typically used for things like road maps or country maps.
Examples & Analogies
Think of map scales like zooming in on a digital photo: the closer you zoom in (large scale), the more detail you can see, but you cover a smaller section of the photo. When you zoom out (small scale), you can see the entire image, but the details are lost, just like how a less detailed map gives you the big picture but lacks specifics.
Map Projections
Chapter 4 of 5
🔒 Unlock Audio Chapter
Sign up and enroll to access the full audio experience
Chapter Content
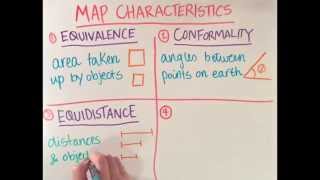
A map projection is a mathematical transformation of Earth's 3D surface onto a 2D map. Types include:
- Conformal (preserves angles): e.g., Mercator.
- Equal Area (preserves area): e.g., Mollweide.
- Equidistant (preserves distance): e.g., Azimuthal Equidistant.
- Compromise (minimizes distortion): e.g., Robinson.
Detailed Explanation
Map projections are necessary to take the three-dimensional shape of the Earth and flatten it into two dimensions for a map. Different types of projections are designed for specific purposes. Conformal projections preserve shape but can distort size. Equal area projections maintain area relationships, making them useful for population studies, while equidistant projections ensure distance measurements are accurate. Lastly, compromise projections strike a balance among various distortions, providing a visually appealing and informative map.
Examples & Analogies
You can think of map projections like using a piece of playdough. If you try to flatten it out, you can stretch or squish parts of it depending on how you press down, similar to how different projections alter the true shape or size of landmasses on a map.
Symbolization
Chapter 5 of 5
🔒 Unlock Audio Chapter
Sign up and enroll to access the full audio experience
Chapter Content
- Use of points, lines, and polygons to represent features.
- Symbol properties:
– Size: Quantity or magnitude.
– Shape: Type of feature.
– Color: Thematic differentiation or intensity.
– Pattern: Texture representation (e.g., forest, water).
Detailed Explanation
Symbolization is a critical aspect of cartography. It involves using points, lines, and polygons to represent various geographic features on a map. The choice of size can indicate the magnitude of a feature, such as a larger dot representing a bigger city. Different shapes can distinguish types of features—like circles for cities and squares for parks. Colors convey different themes—blue for waterways, green for forests—and patterns can add texture to represent things like urban areas or agricultural land.
Examples & Analogies
Think of symbolization like a designer choosing colors and patterns for a room. Each choice impacts how the space feels: bright colors can energize a room, while earth tones create a calming atmosphere. Similarly, the choice of symbols on a map helps communicate different types of information and themes effectively.
Key Concepts
-
Definition of Cartography: The science and art of map-making.
-
Standard Components of a Map: Title, legend, scale, north arrow, grid, source, and date.
-
Map Scales: Classifications include large, medium, and small scales.
-
Map Projections: Techniques to represent the Earth's 3D surface in 2D.
-
Symbolization: Visual representation of geographic features on a map.
Examples & Applications
A city map showing the roads, buildings, and landmarks is a topographic map, while a population density map represents a thematic aspect.
The Mercator projection is used for maritime navigation, preserving angles but distorting area.
Memory Aids
Interactive tools to help you remember key concepts
Rhymes
Maps have titles, scales, and legends bright, to help you find your way and see the light.
Stories
Imagine a sailor lost at sea who uses a map filled with symbols, arrows, and colors to find treasure. Each symbol tells a story, leading him through hidden dangers and clear paths.
Memory Tools
Use the mnemonic 'CLG' for Components of a map: Components, Land features, Grid for orientation.
Acronyms
Remember PAMS** for types of projections
P**roportional
**A**rea
**M**ercator
and **S**chematic.
Flash Cards
Glossary
- Cartography
The science and art of map-making, encompassing the design, production, and study of maps.
- Map Scale
The ratio that describes the relationship between the distance on a map and the actual distance on the ground.
- Map Projection
The method of representing the Earth's curved surface on a flat map, involving various techniques to minimize distortion.
- Symbolization
The use of visual symbols to represent geographic features and data on a map.
- Thematic Map
A map that emphasizes a particular theme or subject, such as population density or land use.
Reference links
Supplementary resources to enhance your learning experience.