
Principles of Thematic Mapping
Enroll to start learning
You’ve not yet enrolled in this course. Please enroll for free to listen to audio lessons, classroom podcasts and take practice test.
Interactive Audio Lesson
Listen to a student-teacher conversation explaining the topic in a relatable way.
Thematic vs. Topographic Maps
🔒 Unlock Audio Lesson
Sign up and enroll to listen to this audio lesson

Today, we're going to discuss the differences between thematic and topographic maps. Can anyone tell me what a topographic map represents?

Isn't it a map that shows physical terrain features like mountains and rivers?
Exactly! Topographic maps depict the physical and man-made features of an area. Now, can someone explain what a thematic map does?

Thematic maps focus on specific themes, like maybe population density or land use?
Good! They highlight specific variables rather than the physical layout of the land. Remember, thematic maps are analytical tools. Why do we need to focus on a single topic when creating them?

So we can easily analyze or interpret data without unnecessary distractions?
That's correct! Keeping the focus helps in making better decisions based on the presented data. Let's summarize: thematic maps focus on one topic and serve analytical purposes, while topographic maps cover broader physical features.
Characteristics of Thematic Maps
🔒 Unlock Audio Lesson
Sign up and enroll to listen to this audio lesson

Now let’s dig deeper into the characteristics of thematic maps. Can someone give an example of a situation where a thematic map would be useful?

How about a map showing areas of high population density for urban planning?
Fantastic example! Thematic maps help visualize data like that. They usually focus on a single topic, which aids in analysis. What else do we know about them?
They are designed for analytical and decision-making purposes!
Exactly. They require careful data classification and effective symbolization to convey information clearly. Remember the concept of data classification. Why might it be important for thematic mapping?
If we classify the data well, it makes the map easier to understand and interpret, right?
Yes! Data classification elevates the clarity and utility of the thematic map. Let's recap: thematic maps focus on one topic, aid in decision-making, and require careful data management.
Thematic Map Design Process
🔒 Unlock Audio Lesson
Sign up and enroll to listen to this audio lesson
Now we will investigate the thematic map design process. Can anyone outline the first step we need?
Data acquisition?
Correct! We start by gathering data, often from surveys or remote sensing. What is a method we might use to classify this data?
We could use quantiles or natural breaks to organize it!
Right! Each method has its advantages in revealing the data's statistical properties. After classification, what’s next?
Choosing the right symbols to represent the data!
Exactly. The symbol selection conveys the data's story effectively. Finally, what do we mean by cartographic generalization?
It’s about simplifying details to focus on key information without cluttering the map!
Perfect! Simplification is essential for optimal map presentation. Let’s summarize: the thematic map design process involves data acquisition, classification, symbol selection, layout design, and generalization.
Introduction & Overview
Read summaries of the section's main ideas at different levels of detail.
Quick Overview
Standard
Thematic mapping is a critical aspect of cartography that focuses on representing specific themes such as socio-economic data, environmental conditions, or population statistics. This section elaborates on the distinguishing characteristics of thematic maps compared to topographic maps, emphasizes the importance of data classification and symbolization, and outlines the systematic design process required to create effective thematic maps.
Detailed
Principles of Thematic Mapping
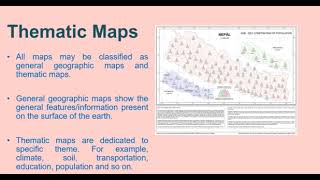
Thematic mapping is a specialized branch of cartography focused on illustrating specific themes or phenomena. Unlike topographic maps that provide a broad view of physical and man-made features, thematic maps zero in on particular variables like population density, rainfall patterns, or socio-economic indicators. The core characteristics of thematic maps include their focus on a single topic, their utility for analytical purposes, and their requirement for careful data classification and symbolization to convey information effectively.
Key Characteristics of Thematic Maps:
- Focus on a Single Topic: Each thematic map addresses one variable, providing targeted insights.
- Analytical Design: The intent behind thematic maps is analytical; they aid decision-making processes by highlighting pertinent patterns and trends.
- Data Classification and Symbolization: The creation of effective thematic maps necessitates rigorous classification of data to enhance readability and interpretation.
Thematic Map Design Process:
To create thematic maps, the following steps are crucial:
1. Data Acquisition: Collect relevant data from sources like surveys, remote sensing, and census reports.
2. Data Classification: Organize data into categories using methods such as Equal Interval, Quantile, Natural Breaks, or Standard Deviation.
3. Symbol Selection: Choose symbols that appropriately represent the data type.
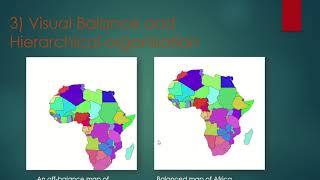
4. Map Layout Design: Design the layout to balance clarity and information density, ensuring the viewer can easily interpret the map.
5. Cartographic Generalization: Simplify the map details while preserving the general messages to avoid overwhelming the user with excessive information.
Understanding these principles is essential for leveraging thematic maps effectively in various applications, including urban planning, environmental management, and public health.
Youtube Videos


Audio Book
Dive deep into the subject with an immersive audiobook experience.
Thematic vs. Topographic Maps
Chapter 1 of 3
🔒 Unlock Audio Chapter
Sign up and enroll to access the full audio experience
Chapter Content
• Topographic maps show physical and man-made features.
• Thematic maps highlight specific themes, such as land use, rainfall, or socio-economic patterns.
Detailed Explanation
Thematic maps and topographic maps serve different purposes in cartography. Topographic maps are designed to represent the physical features of the landscape, showing both natural elements (like rivers and mountains) as well as human-made structures (like buildings and roads). This type of map is useful for navigation and understanding the geography of an area.
On the other hand, thematic maps focus on specific subjects or themes. For instance, a thematic map may illustrate population density across different regions or visualize rainfall patterns. These maps help users analyze spatial relationships regarding particular variables rather than serving general navigation purposes.
Examples & Analogies
Think of topographic maps like a movie that shows the entire cast and the plot of a story. In contrast, thematic maps are like a highlight reel focusing only on a particular character's journey or a specific event in the movie, providing insight into that story element without needing to show the entire plot.
Characteristics of Thematic Maps
Chapter 2 of 3
🔒 Unlock Audio Chapter
Sign up and enroll to access the full audio experience
Chapter Content
• Focuses on a single topic or variable.
• Designed for analytical and decision-making purposes.
• Requires data classification and symbolization.
Detailed Explanation
Thematic maps are characterized by their focus on a single subject, making them ideal tools for conveying specific information. For example, a map showcasing earthquake frequency would not combine unrelated data, but instead, concentrate solely on regions prone to seismic activity. This laser focus helps in analysis and decision-making scenarios, like urban planning or resource allocation.
Furthermore, creating thematic maps necessitates the steps of data classification—which involves categorizing values into groups—and symbolization, which refers to the visual representation of varied data points, ensuring that the information is presented in an understandable manner.
Examples & Analogies
Imagine a researcher studying climate change impacts. Rather than pulling together unrelated topics, they create a thematic map focusing solely on temperature changes over time. This focused map helps policymakers see which areas are most affected, guiding actions like where to direct funding for water conservation or flood defenses.
Thematic Map Design Process
Chapter 3 of 3
🔒 Unlock Audio Chapter
Sign up and enroll to access the full audio experience
Chapter Content
- Data Acquisition: From surveys, remote sensing, census, etc.
- Data Classification:
• Equal Interval
• Quantile
• Natural Breaks (Jenks)
• Standard Deviation - Symbol Selection: Appropriate to data type.
- Map Layout Design: Balancing visual clarity and information density.
- Cartographic Generalization: Simplifying details while retaining key information.
Detailed Explanation
The design of a thematic map follows a systematic process to ensure effectiveness and clarity. It begins with data acquisition, where various sources like surveys and remote sensing provide the necessary information. The next step is data classification, which organizes the data, and can employ methods like Equal Interval (dividing data ranges evenly), Quantile (ensuring each category has an equal number of observations), and others.
Following data classification, the map creator selects symbols that make the information both attractive and accessible, then designs the layout, aiming to maintain a balance between visual appeal and conveying sufficient information. Finally, cartographic generalization simplifies complex details, retaining only the critical elements needed for map users to understand the message.
Examples & Analogies
Creating a thematic map is akin to preparing a recipe for a dish. First, you gather your ingredients (data acquisition). Then, you must chop or arrange them neatly (data classification). Choosing the right cooking method corresponds to finding appropriate symbols for representation. When plating your dish (map layout design), you consider the aesthetics while ensuring enough food to satisfy the diners (information density). Finally, you must simplify the complexities of cooking, ensuring the flavors shine without overwhelming the main taste (cartographic generalization).
Key Concepts
-
Thematic Mapping: A focus on specific themes like socio-economic data.
-
Topographic Maps: Broad maps showing physical and man-made features.
-
Data Classification: Organizing data into meaningful categories.
-
Symbolization: Using symbols for clear representation of data.
-
Cartographic Generalization: Simplifying details for clarity.
Examples & Applications
An urban planner might use a thematic map to show population distribution across a city to identify areas in need of services.
A government agency could create a thematic map displaying areas of high economic activity to guide investment decisions.
Memory Aids
Interactive tools to help you remember key concepts
Rhymes
Thematic maps can really shine, in specific topics, they define. For urban plans, they’re quite the hit, showing trends where we should sit.
Stories
Imagine you’re an urban planner. You walk through a city where every block tells a story. You see color-coded maps where red shows high population and green reveals rich parks. With each map, decisions become clearer, making the city's growth smarter.
Memory Tools
To remember the steps in thematic map design: AD-C-S-L-G (Acquire Data, Classify Data, Select Symbols, Layout Design, Generalization).
Acronyms
MAPS (Maps Are Purposeful Symbols) to remember thematic maps serve specific analytical purposes.
Flash Cards
Glossary
- Thematic Map
A type of map that focuses on a specific theme or variable, such as population density or land use.
- Topographic Map
A map that illustrates physical and man-made features of a landscape, providing detailed geographical information.
- Data Classification
The process of organizing data into categories to facilitate better understanding and interpretation.
- Symbolization
The use of symbols (colors, shapes) to represent data on a map.
- Cartographic Generalization
The process of simplifying a map's details to enhance clarity and focus on key information.
Reference links
Supplementary resources to enhance your learning experience.