
Combining Size Distribution Curves
Enroll to start learning
You’ve not yet enrolled in this course. Please enroll for free to listen to audio lessons, classroom podcasts and take practice test.
Interactive Audio Lesson
Listen to a student-teacher conversation explaining the topic in a relatable way.
Understanding Soil Description vs. Classification
🔒 Unlock Audio Lesson
Sign up and enroll to listen to this audio lesson

Today, we will explore the difference between soil description and classification. Can anyone explain what they think describes a soil?

I think soil description involves saying what it looks like, like color or texture.
Exactly! It's all about the physical properties. Now, how is classification different?

Is it about grouping soils based on their behavior?
Yes, classification is grouping soils with similar characteristics. Remember, we focus on mechanical properties like permeability and strength. Think of it as sorting your clothes into categories.

So, if we have several soil samples, classification helps us make meaningful comparisons?
Precisely! And that’s crucial for engineers. Let's summarize: soil description focuses on observation, while classification groups based on behavior.
Measuring Particle Sizes
🔒 Unlock Audio Lesson
Sign up and enroll to listen to this audio lesson

Next, let’s dive into how we measure particle sizes in soils. What methods do you know?

I remember something about sieving. Is that one of the methods?
Yes! Wet sieving is indeed a method for separating fine grains. What about the dry sieve analysis?
Is it also used for coarser grains?
Exactly! Coarser grains are dried and shaken through different sieves. The collected weights allow us to determine the distribution of sizes. Remember: more sieves means more precise data.
And what about fine particles under 75 microns?
Great question! For those, we use sedimentation analysis, where particles are allowed to settle in water. The principle relates to how different sizes settle at different rates. Keep these methods clear in your mind!
Interpreting Grain-Size Distribution Curves
🔒 Unlock Audio Lesson
Sign up and enroll to listen to this audio lesson
Now that we know how to measure particle sizes, let’s discuss combining this data into a grading curve. Who can explain what a grading curve represents?
It shows the relative amounts of different particle sizes in a soil sample?
Correct! The x-axis represents grain size, and the y-axis shows the percentage passing. What do we call the combination of coarse and fine distributions?
Isn't it the grain-size distribution curve?
Yes! Now, from that curve, we can gather essential information such as grading characteristics and what fractions of gravel, sand, silt, and clay are present. It’s crucial for understanding soil behavior.
And this curve helps engineers decide how to work with a specific soil type, right?
Absolutely! Summarizing, the grading curve helps evaluate soil texture and uniformity, guiding engineering decisions.
Grading Characteristics of Soils
🔒 Unlock Audio Lesson
Sign up and enroll to listen to this audio lesson
Let’s wrap up our session by examining grading characteristics! Who can recall how we determine effective size from the grading curve?
It's derived from the D10 point, right?
Exactly! And what do we use the D60 and D30 points for?
They help us in calculating the uniformity coefficient and curvature coefficient.
Great answer! Uniformity coefficients indicate how well-graded or poorly graded a soil is. Do you remember the ranges?
C > 5 indicates well-graded, C between 1 and 3 is also acceptable, and C < 3 means uniform soil.
Spot on! This ability to assess soil will lead to better engineering solutions. Always keep an eye on these grading characteristics.
Introduction & Overview
Read summaries of the section's main ideas at different levels of detail.
Quick Overview
Standard
Soil classification involves both description and classification methods to understand soil properties. This section focuses on measuring particle size distributions and the importance of combining coarse and fine grain data to create comprehensive grading curves, which provide crucial information for engineering applications.
Detailed
Combining Size Distribution Curves
Soil classification is essential for effective ground investigations in engineering contexts. The distinction between soil description—which captures the physical properties of soil—and soil classification—which divides soil into groups based on key characteristics—is critical. The size distribution of particles and the soil's plasticity are the two primary factors for classification.
To analyze particle size distribution, several tests are utilized:
- Wet Sieving: Used for separating fine particles from coarse grains using a 75-micron sieve.
- Dry Sieve Analysis: For particles coarser than 75 microns, where samples are dried and passed through a series of sieves to measure particle distribution.
- Sedimentation Analysis: Applied to particles finer than 75 microns. In this method, soil is suspended in water, and particles settle at different rates. Using hydrometer readings allows for calculating particle sizes.
The resulting data leads to the creation of a grain-size distribution curve (or grading curve), which displays particle sizes on a logarithmic scale against the percentage passing on an arithmetic scale. These curves help in determining grading characteristics, effective size, and uniformity of soils.
Effective size is derived from three key grading points (D60, D30, and D10) and provides insights into soil texture and behavior. A well-graded soil typically exhibits a uniformity coefficient above 5, while less diverse particle size distributions indicate a more uniform soil profile.
Youtube Videos


Audio Book
Dive deep into the subject with an immersive audiobook experience.
Combining Coarse and Fine Grained Portions
Chapter 1 of 5
🔒 Unlock Audio Chapter
Sign up and enroll to access the full audio experience
Chapter Content
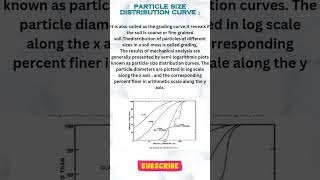
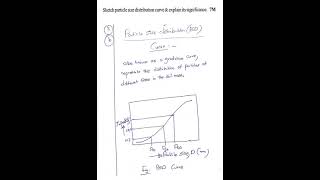
The size distribution curves, as obtained from coarse and fine grained portions, can be combined to form one complete grain-size distribution curve (also known as grading curve). A typical grading curve is shown.
Detailed Explanation
In soil analysis, we often look at the grain-size distribution of soil samples. This involves measuring how different sized particles, like sand and clay, are spread out within the sample. The curves you get from testing coarse and fine materials separately represent how much of each size is present. By combining these two curves, we create a single, comprehensive graph called a grading curve. This curve helps us visualize the overall distribution of particle sizes in the soil sample and allows for easier interpretation and comparison.
Examples & Analogies
Think of this process like making a fruit salad. You first prepare two separate bowls: one with bigger chunks of fruit (like apples or pears) and another with smaller pieces (like berries). Once you have both prepared, you combine them into one bowl. This final bowl represents your complete fruit salad, just like the grading curve combines the size distributions of coarse and fine particles into one comprehensive view.
Information from the Complete Grain-Size Distribution Curve
Chapter 2 of 5
🔒 Unlock Audio Chapter
Sign up and enroll to access the full audio experience
Chapter Content
From the complete grain-size distribution curve, useful information can be obtained such as:
1. Grading characteristics, which indicate the uniformity and range in grain-size distribution.
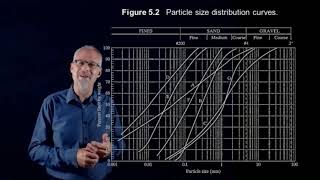
2. Percentages (or fractions) of gravel, sand, silt and clay-size.
Detailed Explanation
Once we have a complete grain-size distribution curve, it reveals important characteristics of the soil. First, the grading characteristics tell us how uniform the particle sizes are—whether they are mostly similar or varied. Second, by analyzing the curve, we can determine the proportions of different components like gravel, sand, silt, and clay. This information is crucial for understanding how the soil will behave in various conditions, such as drainage, compaction, or stability.
Examples & Analogies
Imagine checking the ingredient list on a pizza. By analyzing the proportions of cheese, sauce, and toppings, you can determine what kind of pizza it is. Similarly, analyzing the grading curve gives us insights into what kind of soil we are dealing with based on its components.
Understanding Grading Characteristics
Chapter 3 of 5
🔒 Unlock Audio Chapter
Sign up and enroll to access the full audio experience
Chapter Content
A grading curve is a useful aid to soil description. The geometric properties of a grading curve are called grading characteristics.
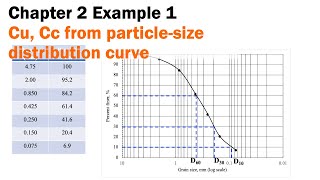
To obtain the grading characteristics, three points are located first on the grading curve.
D60 = size at 60% finer by weight
D30 = size at 30% finer by weight
D10 = size at 10% finer by weight
Detailed Explanation
To extract meaningful information from the grading curve, we focus on three critical points that describe its shape: D60, D30, and D10. These values correspond to the particle sizes that allow 60%, 30%, and 10% of the soil sample to pass through a sieve. The D60, D30, and D10 points provide insight into the soil's gradation and help determine how quickly water can move through it or how well it can bear loads.
Examples & Analogies
Consider a water filter with different layers. The size of each layer’s material affects how quickly water passes through. D60, D30, and D10 are like measuring the heights of the layers; they help us understand how the filter (or in this case, the soil) will perform under various situations.
Calculating Grading Characteristics
Chapter 4 of 5
🔒 Unlock Audio Chapter
Sign up and enroll to access the full audio experience
Chapter Content
The grading characteristics are then determined as follows:
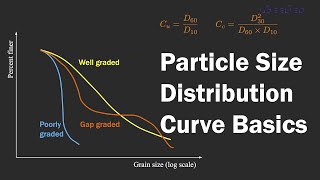
1. Effective size = D10
2. Uniformity coefficient, Cu
3. Curvature coefficient, Cc
Detailed Explanation
Once we identify the three critical D points on the grading curve, we can calculate several key grading characteristics. The effective size is simply the D10 value, which represents a critical point of soil performance. The uniformity coefficient (Cu) indicates how well-graded the soil is; a higher Cu means a wider range of particle sizes. Lastly, the curvature coefficient (Cc) gives insight into the distribution pattern of the sizes—the more varied the sizes, the higher the Cc. Together, these values help engineers make informed decisions about soil usage and behavior.
Examples & Analogies
Picture a team sport where players have different skills. The effective size is like identifying the key player (D10). The uniformity coefficient tells you if you have a diverse team (high Cu) or a team with similar skills (low Cu). Finally, the curvature coefficient lets you see how strategically diverse the distribution of skills is. Like a well-rounded team, a well-graded soil is more resilient and effective.
Interpreting Uniformity Coefficient and Curvature Coefficient
Chapter 5 of 5
🔒 Unlock Audio Chapter
Sign up and enroll to access the full audio experience
Chapter Content
Both Cu and Cc will be 1 for a single-sized soil.
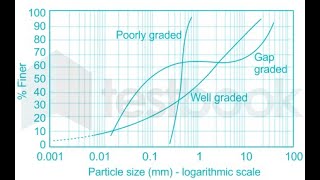
Cu > 5 indicates a well-graded soil, i.e. a soil which has a distribution of particles over a wide size range.
Cu between 1 and 3 also indicates a well-graded soil.
Cu < 3 indicates a uniform soil, i.e. a soil which has a very narrow particle size range.
Detailed Explanation
When interpreting the uniformity coefficient (Cu) and curvature coefficient (Cc), certain ranges indicate specific soil characteristics. When Cu is equal to 1, it suggests that all soil particles are of the same size. A Cu greater than 5 indicates a well-graded soil with a variety of particle sizes, while a Cu between 1 and 3 still suggests good gradation. Conversely, a Cu less than 3 indicates a uniform soil where the particle sizes are quite similar, which might limit the soil's stability and drainage capacity.
Examples & Analogies
Imagine a party where everyone's dancing. If everyone is doing the same dance move (Cu = 1), the energy may be dull. If the moves range wildly (Cu > 5), the atmosphere is lively. If some do similar moves (Cu < 3), the energy is again limited. A well-graded soil is like a lively party with diverse dance moves—it's more dynamic and can handle different situations better.
Key Concepts
-
Soil Classification: Dividing soils into groups based on behavior and properties.
-
Particle Size Measurement: Various methods like wet sieving and sedimentation for size analysis.
-
Grading Curve: A graphical representation combining size distributions, showing soil characteristics.
-
Effective Size: A significant point on the grading curve indicating soil texture.
-
Uniformity and Curvature Coefficients: Metrics to evaluate the range and shape of particle size distributions.
Examples & Applications
For a soil sample consisting of 20% gravel, 30% sand, 40% silt, and 10% clay, a grading curve can visually depict these proportions on a graph, helping engineers understand its suitability for construction.
In sedimentation analysis, if a soil sample exhibits a uniformity coefficient of 8, it indicates a well-graded soil with a wide range of particle sizes.
Memory Aids
Interactive tools to help you remember key concepts
Rhymes
To know your soil sizes, don’t be a loner, just sieve and settle for a proper earner!
Stories
Imagine a baker who uses different flour types: coarse for bread, fine for cakes. Just like them, soil particles need to be categorized by size for the right construction mix.
Memory Tools
CUP for remembering the grading characteristics: C for Coefficient, U for Uniformity, and P for Particle size distribution.
Acronyms
G.E.S. for Grain Size characteristics
for Gradation
for Effective size
for Stability in engineering.
Flash Cards
Glossary
- Soil Description
A statement that describes the physical nature and state of the soil based on visual examination and simple tests.
- Soil Classification
The separation of soil into classes or groups with similar characteristics and behaviors based on their mechanical properties.
- GrainSize Distribution Curve
A graph showing the percentages of soil particles at varying sizes, providing insight into soil composition.
- Effective Size (D10)
The size at which 10% of the soil sample's weight consists of smaller particles.
- Uniformity Coefficient
A measure used to describe the range of particle sizes in a soil sample; higher values indicate well-graded soils.
- Curvature Coefficient
A coefficient that indicates the shape of the grading curve; it suggests the distribution pattern of different particle sizes.
Reference links
Supplementary resources to enhance your learning experience.