
Grain-Size Distribution Curve
Enroll to start learning
You’ve not yet enrolled in this course. Please enroll for free to listen to audio lessons, classroom podcasts and take practice test.
Interactive Audio Lesson
Listen to a student-teacher conversation explaining the topic in a relatable way.
Understanding Soil Classification
🔒 Unlock Audio Lesson
Sign up and enroll to listen to this audio lesson

Welcome class! Today we're diving into soil classification. Can anyone tell me the difference between describing soil and classifying it?

Isn't describing soil just about looking at it and saying what it looks like?
Exactly! Description is based on visual examination and observations. Classification, on the other hand, sorts soil into groups with similar characteristics. Why do you think that might matter for engineers?

Because they need to understand how the soil will behave?
Right! Understanding behavior such as strength and permeability is crucial. Let's remember: *Description is seeing; Classification is grouping.*
Methods of Measuring Particle Sizes
🔒 Unlock Audio Lesson
Sign up and enroll to listen to this audio lesson

Now let's move on to methods for measuring particle sizes in soils. Who knows what 'wet sieving' involves?

I think it's washing the soil through a sieve?
That's correct! We use a 75-micron sieve for fine grains. What about dry sieve analysis?

That's for coarser grains, right? We shake them through different sized sieves.
Exactly! And what about sedimentation analysis? This is crucial for the very fine particles.
It's when the soil is put in water and we measure how it settles, isn't it?
Correct! It helps determine particle size based on how quickly they settle. Remember: *Wet for fine; Dry for coarse; Sediment for the tiniest.*
Creating and Interpreting the Grain-Size Distribution Curve
🔒 Unlock Audio Lesson
Sign up and enroll to listen to this audio lesson
Let’s now talk about the grain-size distribution curve. Can anyone explain what that tells us?
It shows the percent of particles that are smaller than a given size, right?
Exactly! This curve plots grain size on the x-axis and the percentage passing on the y-axis. What kind of information do we get from this curve?
We can see the grading characteristics?
Yes! It includes uniformity and size range. We can find D10, D30, and D60. Who remembers what D10 is?
It's the size at which 10% of the soil is finer!
Perfect! So we get a complete picture of the soil's grading by analyzing these points.
Exploring Grading Characteristics in Detail
🔒 Unlock Audio Lesson
Sign up and enroll to listen to this audio lesson
Finally, let’s dig deeper into grading characteristics. What do we mean by uniformity coefficient?
It measures how well-graded the soil is, right?
That's correct! A uniformity coefficient greater than 5 indicates well-graded soil. What about the curvature coefficient?
It helps us see how the distribution curve's shape looks?
Exactly! Understanding these coefficients helps in predicting soil behavior and stability. Remember: *Cu high means variety; low means uniformity.*
Introduction & Overview
Read summaries of the section's main ideas at different levels of detail.
Quick Overview
Standard
In this section, the concept of grain-size distribution curves is explored in detail, outlining the methods used for measuring particle sizes and how the resulting curves can provide critical information about soil classification, including grading characteristics and uniformity.
Detailed
Grain-Size Distribution Curve
The grain-size distribution curve, commonly referred to as the grading curve, is essential for classifying soils based on the size distribution of their particles. This section explains the methods for measuring grain sizes, such as wet sieving and sedimentation analysis, and how these measurements are used to create a grading curve that visually represents the distribution of soil particles.
Key Points Covered:
- Soil Classification: Soil classification is crucial in engineering, distinguishing between general description and specific classification based on mechanical properties.
- Measuring Particle Sizes: Different methods are used to determine the distribution of particle sizes:
- Wet Sieving: Utilized for fine grains, employing a 75-micron sieve.
- Dry Sieve Analysis: For coarser particles over 75 microns, where particles are dried and sifted through a series of sieves.
- Sedimentation Analysis: For particles finer than 75 microns, involving measuring settling rates of particles in suspension.
- Creating the Grain-Size Distribution Curve: This curve plots the particle sizes against the cumulative percentage passing each size, providing visual insight into the soil sample.
- Grading Characteristics: The grading curve offers valuable information regarding the uniformity and range of grain sizes, characterized by the effective size (D10), uniformity coefficient (Cu), and curvature coefficient (Cc), allowing for assessments of soil gradation.
Youtube Videos


Audio Book
Dive deep into the subject with an immersive audiobook experience.
Overview of Grain-Size Distribution Curve
Chapter 1 of 4
🔒 Unlock Audio Chapter
Sign up and enroll to access the full audio experience
Chapter Content
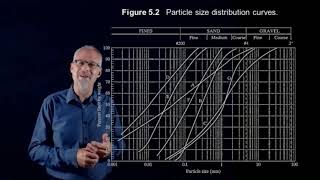
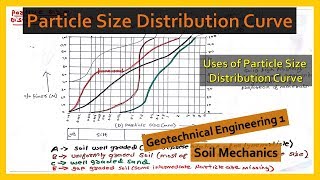
The size distribution curves, as obtained from coarse and fine grained portions, can be combined to form one complete grain-size distribution curve (also known as grading curve). A typical grading curve is shown.
Detailed Explanation
A grain-size distribution curve is a graphical representation of the particle size distribution in a soil sample. It shows how much of the soil is made up of different size particles, which is crucial for understanding soil behavior. The curve combines data from both coarse and fine grained soils, allowing for a comprehensive view of the material's characteristics.
Examples & Analogies
Think of the grain-size distribution curve like a music playlist that encompasses a variety of genres. It represents all types of particles in the soil much like the playlist showcases different music styles—helping one understand the overall mix and characteristics of the final output.
Information from the Grain-Size Distribution Curve
Chapter 2 of 4
🔒 Unlock Audio Chapter
Sign up and enroll to access the full audio experience
Chapter Content
From the complete grain-size distribution curve, useful information can be obtained such as:
1. Grading characteristics, which indicate the uniformity and range in grain-size distribution.
2. Percentages (or fractions) of gravel, sand, silt and clay-size.
Detailed Explanation
The curve provides significant insights, including grading characteristics that reveal how uniformly particles are distributed in size. For instance, if a soil has a mix of particle sizes (like sands and silts), the grading curve will reflect that variety. Additionally, the specific percentages of gravel, sand, silt, and clay sizes can be derived from the curve, which helps determine the soil's classification and suitability for various engineering applications.
Examples & Analogies
Consider a cake made of different layers, like a chocolate, vanilla, and red velvet. Just as the layers tell you about the cake's richness and texture, the grading curve informs you about the soil's composition and strength potential for construction projects.
Grading Characteristics
Chapter 3 of 4
🔒 Unlock Audio Chapter
Sign up and enroll to access the full audio experience
Chapter Content
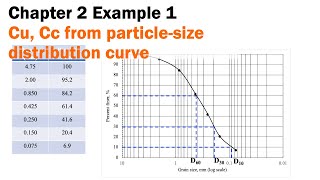
A grading curve is a useful aid to soil description. The geometric properties of a grading curve are called grading characteristics. To obtain the grading characteristics, three points are located first on the grading curve.
- D60 = size at 60% finer by weight
- D30 = size at 30% finer by weight
- D10 = size at 10% finer by weight
Detailed Explanation
Grading characteristics are specific measurements taken from the grading curve. These include the diameters at which 60%, 30%, and 10% of the soil particles are smaller. These measurements help classify and describe the soil accurately. For example, D60 tells us the size below which 60% of the particles could fit, giving insight into the soil's composition and behavior under load.
Examples & Analogies
Imagine you have a collection of balls of different sizes. Finding the sizes that represent the middle (say, the 10th, 30th, and 60th percentiles) helps you understand the general size range of your collection, just like how D60, D30, and D10 help characterize the soil.
Effective Size and Uniformity Coefficient
Chapter 4 of 4
🔒 Unlock Audio Chapter
Sign up and enroll to access the full audio experience
Chapter Content
The grading characteristics are then determined as follows:
1. Effective size = D10
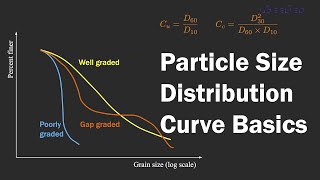
2. Uniformity coefficient, Cu = D60/D10
3. Curvature coefficient, Cc = (D30^2) / (D10 * D60)
Both Cu and Cc will be 1 for a single-sized soil.
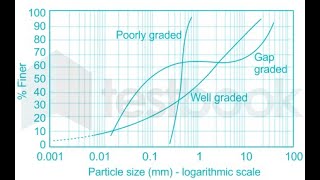
Cu > 5 indicates a well-graded soil, i.e., a soil which has a distribution of particles over a wide size range.
Cu between 1 and 3 also indicates a well-graded soil.
Cu < 3 indicates a uniform soil, i.e., a soil which has a very narrow particle size range.
Detailed Explanation
The effective size (D10) is a key aspect of the grading characteristics that informs about the smallest size of the larger fraction of particles. The uniformity coefficient (Cu) indicates the range of particle sizes; a high value means a well-graded soil, while a low value suggests uniformity and a narrow range of sizes. The curvature coefficient (Cc) assesses how well the sizes fit together, providing additional information about soil stability and packing.
Examples & Analogies
Consider building a set of shelves. If you use only one size of boards (low uniformity), the structure may not be stable. However, if you mix various sizes optimally (high uniformity), the shelf can hold more weight effectively, just like well-graded soil supports structures better.
Key Concepts
-
Grain-Size Distribution Curve: A visual representation of particle sizes in soil.
-
Soil Classification: The process of categorizing soil types based on physical and mechanical properties.
-
Effective Size (D10): Critical point indicating particle size distribution.
-
Uniformity Coefficient: A ratio that indicates soil grading quality.
Examples & Applications
A grain-size distribution curve showing a well-graded soil with a diverse size range from gravel to clay, indicating multiple particle size categories.
A curve demonstrating poorly graded soil, displayed with a steep slope, suggesting minimal variation in particle sizes.
Memory Aids
Interactive tools to help you remember key concepts
Rhymes
Sizing soil is quite the art, To find the grains must play our part. Wet and dry, they'll show the score, To build our curves and learn much more.
Stories
Imagine an engineer in a lab, sorting soil samples by size like a chef sorts ingredients for a fine dish. They use different sieves, like measuring cups, to ensure the right proportions. Each particle tells a story about the ground beneath us.
Memory Tools
Remember 'WDS' for measurement: Wet for fine, Dry for coarse, Settlement in suspension.
Acronyms
Use 'CUGS' to remember the grading characteristics
for Curvature
for Uniformity
for Grading curve
for Size.
Flash Cards
Glossary
- GrainSize Distribution Curve
A graphical representation of the distribution of particle sizes within a soil sample.
- Wet Sieving
A method of separating fine grains from coarse grains using water and a sieve.
- Dry Sieve Analysis
A method for analyzing coarser soil particles by passing them through a set of sieves.
- Sedimentation Analysis
A technique used to determine the size of fine particles in suspension by measuring their settling rate.
- Effective Size (D10)
The particle size at which 10% of the total weight of the soil sample is finer.
- Uniformity Coefficient (Cu)
A measure of the range of particle sizes in a soil sample, calculated as D60/D10.
- Curvature Coefficient (Cc)
A measure of the shape of the grading curve, indicating how well the particles are distributed.
Reference links
Supplementary resources to enhance your learning experience.