
Dry Sieve Analysis
Enroll to start learning
You’ve not yet enrolled in this course. Please enroll for free to listen to audio lessons, classroom podcasts and take practice test.
Interactive Audio Lesson
Listen to a student-teacher conversation explaining the topic in a relatable way.
Introduction to Dry Sieve Analysis
🔒 Unlock Audio Lesson
Sign up and enroll to listen to this audio lesson

Today, we will discuss dry sieve analysis. Can anyone explain why analyzing soil particle sizes is critical?

It's important for classifying soil, which helps in construction projects.
Exactly! This method is specifically used for particles larger than 75 microns. Remember, dry sieve analysis helps us understand the mechanical properties of the soil.

How do we conduct this analysis?
We dry the soil sample, shake it through a series of sieves, and measure the weight retained on each sieve. Let’s remember the acronym 'DSA' for Dry Sieve Analysis!
Process of Dry Sieve Analysis
🔒 Unlock Audio Lesson
Sign up and enroll to listen to this audio lesson

Let’s get into the steps of dry sieve analysis. First, we dry the soil sample and ensure that only coarse particles remain. Why is this important?

So that we only analyze the larger particles?
Correct! We then shake the sample through the sieves and weigh the soil left in each sieve. What will we do next with this data?

We'll calculate the cumulative percentage of particles that pass through each sieve.
Exactly! Then we can plot this data to create our grain-size distribution curve. Remember, this plot is vital for understanding soil behavior!
Interpreting the Grading Curve
🔒 Unlock Audio Lesson
Sign up and enroll to listen to this audio lesson
Once we have our grain-size distribution curve, what do we look for?
We examine grading characteristics like the effective size and uniformity coefficient.
Great! What's the significance of these characteristics?
They help determine if the soil is well-graded or uniformly graded!
Exactly! And understanding these properties helps us predict how the soil will behave in engineering applications.
Introduction & Overview
Read summaries of the section's main ideas at different levels of detail.
Quick Overview
Standard
This section covers the process and significance of dry sieve analysis in soil classification, explaining how to measure the weight retained on each sieve and determine cumulative percentage quantities, which lead to the construction of a grain-size distribution curve essential for engineering applications.
Detailed
Dry Sieve Analysis
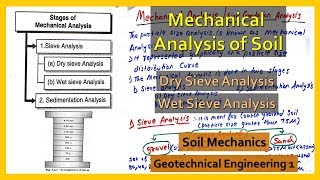
Dry sieve analysis is an integral method for assessing the particle size distribution of soil, particularly focusing on particles larger than 75 microns. This process precedes the classification of soil, which is crucial in engineering contexts. The analysis involves drying a soil sample, removing fine particles, and shaking the remaining sample through a series of sieves of decreasing size. The weight of soil retained in each sieve is recorded, and the cumulative percentage of soil that passes through the sieves is calculated.
The results inform the creation of a grain-size distribution curve, wherein the size of the particles is plotted on a logarithmic scale against the percentage of particles passing on an arithmetic scale. This curve is critical for evaluating grading characteristics and understanding soil behavior, allowing engineers to classify soils effectively based on their mechanical properties like permeability, stiffness, and strength. Additionally, the section discusses how grading characteristics are derived from the grain-size curve, highlighting the importance of effective size, uniformity coefficient, and curvature coefficient, and their relevance in determining soil types for engineering applications.
Youtube Videos


Audio Book
Dive deep into the subject with an immersive audiobook experience.
Overview of Dry Sieve Analysis
Chapter 1 of 3
🔒 Unlock Audio Chapter
Sign up and enroll to access the full audio experience
Chapter Content
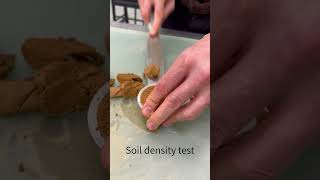
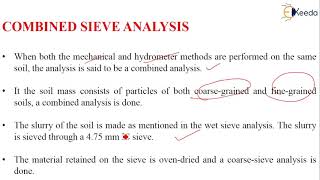
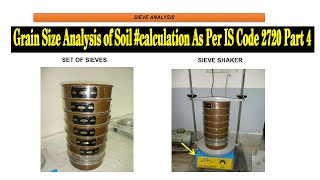
Dry sieve analysis is carried out on particles coarser than 75 micron. Samples (with fines removed) are dried and shaken through a set of sieves of descending size.
Detailed Explanation
Dry sieve analysis is a method used to determine the particle size distribution of soil particles that are larger than 75 microns. In this process, the soil sample is first dried to eliminate moisture. Then, the sample is shaken through a series of sieves, each with progressively smaller openings, allowing particles to be sorted based on their size.
Examples & Analogies
Imagine you have a box of different sized marbles, and you want to separate them by size. You use several colanders with holes of different sizes. When you pour the marbles into the largest colander, the bigger ones stay while the smaller ones fall through. You then repeat this process with smaller colanders until all the marbles are sorted. This is essentially how dry sieve analysis works with soil particles.
Weight Measurement and Data Compilation
Chapter 2 of 3
🔒 Unlock Audio Chapter
Sign up and enroll to access the full audio experience
Chapter Content
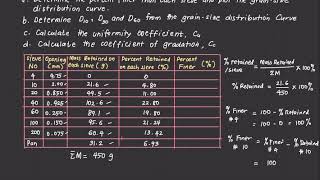
The weight retained in each sieve is measured. The cumulative percentage quantities finer than the sieve sizes (passing each given sieve size) are then determined.
Detailed Explanation
Once the soil has passed through the sieves, the next step is to measure the weight of soil retained on each sieve. This weight allows for the calculation of the cumulative percentage of soil particles that are finer than the sieve sizes. This cumulative data helps to form a complete picture of the soil's particle size distribution.
Examples & Analogies
Think of a baking process where you sift flour to remove lumps. As you sift, the fine flour falls through while the lumps get caught on the screen. By measuring how much flour is left on the screen after each sifting, you can see how much fine flour has passed through, helping you understand the quality of your flour after sifting.
Distribution Curve Presentation
Chapter 3 of 3
🔒 Unlock Audio Chapter
Sign up and enroll to access the full audio experience
Chapter Content
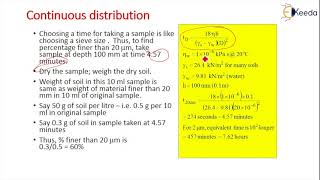
The resulting data is presented as a distribution curve with grain size along x-axis (log scale) and percentage passing along y-axis (arithmetic scale).
Detailed Explanation
After the measurements are completed, the data collected from the sieve analysis is plotted on a graph known as the distribution curve. The x-axis represents the particle size on a logarithmic scale, while the y-axis shows the cumulative percentage of particles passing through the sieves on a standard arithmetic scale. This curve visually represents how the sizes of particles are distributed within the soil sample.
Examples & Analogies
Imagine you're tracking the scores of students in a class on a test. You might plot their scores on a graph where the scores (ranging from 0-100) are on the horizontal axis, and the number of students who received those scores is on the vertical axis. This helps you visualize how students performed overall, just as the distribution curve helps visualize particle sizes in soil.
Key Concepts
-
Soil Description: A visual and contextual understanding of the soil's physical properties.
-
Soil Classification: Grouping soils based on mechanical properties for engineering purposes.
-
Dry Sieve Analysis: A common method for assessing soil particle sizes larger than 75 microns.
Examples & Applications
Example 1: If a dry sieve analysis shows that 50% of soil passes through a 2 mm sieve, it indicates that half of the sample consists of particles smaller than this size.
Example 2: A soil with a uniformity coefficient greater than 5 can be classified as well-graded, indicating a good range of particle sizes.
Memory Aids
Interactive tools to help you remember key concepts
Rhymes
If the soil is coarse and needs to compare, dry sieve analysis will get us there!
Stories
Imagine a school of fish, where each fish is a particle. They swim through a net (the sieves) of different hole sizes, showing how many slipped through. The fish left behind tell the story of the soil's size distribution.
Memory Tools
To remember the steps: 'Damp, Shake, Weigh, Plot!'
Acronyms
DSA = Dry Sieve Analysis
Flash Cards
Glossary
- Dry Sieve Analysis
A method used to determine the particle size distribution of soil by passing dried samples through a series of sieves.
- Grading Curve
A graphical representation of the particle size distribution of a soil sample, showing the percentage passing versus particle size.
- Effective Size (D10)
The particle size at which 10% of the soil sample's weight is finer.
- Uniformity Coefficient (Cu)
A coefficient that indicates the range of particle sizes in a soil sample; calculated as Cu = D60/D10.
- Curvature Coefficient (Cc)
A coefficient that indicates the shape of the grading curve; calculated using D30.
Reference links
Supplementary resources to enhance your learning experience.