
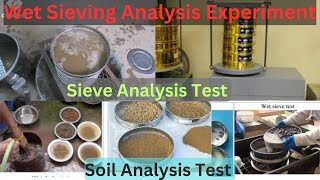
Wet Sieving
Enroll to start learning
You’ve not yet enrolled in this course. Please enroll for free to listen to audio lessons, classroom podcasts and take practice test.
Interactive Audio Lesson
Listen to a student-teacher conversation explaining the topic in a relatable way.
Introduction to Wet Sieving
🔒 Unlock Audio Lesson
Sign up and enroll to listen to this audio lesson

Today, we're discussing wet sieving. Can anyone tell me its main purpose?

Is it to separate different sizes of soil particles?
Exactly! We specifically use it to separate fine grains from coarse ones. We wash soil through a 75 micron sieve. Why do you think this is important in engineering?

To understand how the soil will behave under pressure or load?
Yes, knowing the particle size helps predict that behavior! Let's remember the '75 micron' sieve as our cutoff with the mnemonic '75 holds the fine from the coarse'.
Dry Sieve Analysis vs Wet Sieving
🔒 Unlock Audio Lesson
Sign up and enroll to listen to this audio lesson

Now, how does dry sieve analysis differ from wet sieving?

Dry sieving is for particles larger than 75 microns, right?
Correct! In dry sieve, we dry samples and shake them through successively smaller sieves. Student_4, can you explain why we don’t use this for finer particles?

Finer particles might stick together when dry, making it hard to measure their size accurately.
Exactly! They require wet sieving for proper separation. Remember, dry sieving can’t 'see' the small fines!
Sedimentation Analysis
🔒 Unlock Audio Lesson
Sign up and enroll to listen to this audio lesson
In addition to wet sieving, we also perform sedimentation analysis on particles finer than 75 microns. What do we need for this method?
A jar filled with distilled water and a deflocculating agent, right?
Correct! We need both to create a suspension. Student_2, can you describe how we analyze the settling of particles?
We measure the concentration of particles at different levels using a hydrometer, along with the specific gravity.
That's right! This helps us plot the particle size distribution. Keep in mind the term 'sedimentation' by imagining sediments settling like leaves on a pond.
Grain-Size Distribution Curve
🔒 Unlock Audio Lesson
Sign up and enroll to listen to this audio lesson
We can combine our results into a grain-size distribution curve. Who can tell me what we can learn from this curve?
It shows the grading characteristics of the soil!
Yes! It indicates uniformity and size range. Student_4, what are the points we typically locate on this curve?
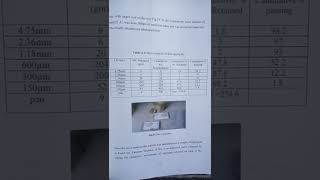
D60, D30, and D10 for effective size and uniformity coefficient.
Perfect! Remember D60 for 'D' at 60% finer, which helps define our soil's characteristics.
Introduction & Overview
Read summaries of the section's main ideas at different levels of detail.
Quick Overview
Standard
This section discusses the wet sieving process, how it differs from dry sieving, and introduces sedimentation analysis as part of soil classification. It emphasizes the significance of understanding soil particle size distribution for engineering applications.
Detailed
Wet Sieving
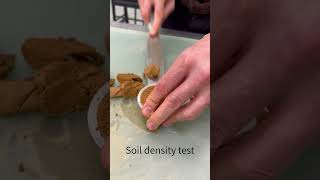
Wet sieving is a crucial technique in soil classification and analysis, particularly for distinguishing between fine and coarse soil grains. In this process, soil is washed through a 75 micron sieve mesh to separate finer particles from coarser ones. Unlike dry sieve analysis, which deals with particles coarser than 75 microns, wet sieving effectively handles finer soils that may be clumped together. This ensures accurate measurement of particle size distribution, as fine soils tend to agglomerate and may not pass through a dry sieve effectively.
In addition to wet sieving, sedimentation analysis is utilized for soil fractions finer than 75 microns. Through this method, soil particles suspended in water settle over time, and their concentration can be gauged using a hydrometer, allowing for the determination of particle size distribution based on their settling rate. The information acquired from both wet sieving and sedimentation is vital for generating a comprehensive grain-size distribution curve, or grading curve, which reveals significant grading characteristics of the soil, such as effective size, uniformity coefficient, and curvature coefficient. Understanding these characteristics aids engineers in predicting soil behavior under varying conditions.
Youtube Videos


Audio Book
Dive deep into the subject with an immersive audiobook experience.
Introduction to Wet Sieving
Chapter 1 of 4
🔒 Unlock Audio Chapter
Sign up and enroll to access the full audio experience
Chapter Content
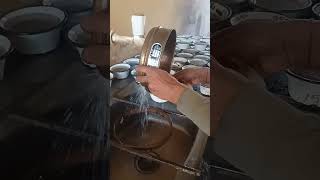
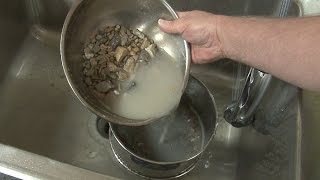
Wet sieving is carried out for separating fine grains from coarse grains by washing the soil specimen on a 75 micron sieve mesh.
Detailed Explanation
Wet sieving is a method used to separate soil particles based on their size. The process involves washing the soil through a sieve with a mesh size of 75 microns. This mesh allows finer particles to pass through while retaining larger particles. By doing this, we can effectively categorize the soil into fine and coarse components, which is crucial for soil classification.
Examples & Analogies
Imagine trying to filter tea leaves from brewed tea. In this analogy, the sieve acts like a fine strainer that lets only the liquid pass through while trapping the leaves. Similarly, in wet sieving, only the finer soil particles can pass through the sieve while the larger ones are retained.
Dry Sieve Analysis
Chapter 2 of 4
🔒 Unlock Audio Chapter
Sign up and enroll to access the full audio experience
Chapter Content
Dry sieve analysis is carried out on particles coarser than 75 micron. Samples (with fines removed) are dried and shaken through a set of sieves of descending size. The weight retained in each sieve is measured.
Detailed Explanation
Dry sieve analysis is another method used to evaluate soil particle size. This technique is applied to particles larger than 75 microns. The soil sample is first dried and then placed on a series of sieves that decrease in size. When the sample is shaken, larger particles remain trapped in the upper sieves, while smaller particles fall through. The amount of soil retained in each sieve is recorded, which helps in understanding the distribution of particles in the sample.
Examples & Analogies
Think about sorting different-sized balls using a set of stacked baskets. The largest balls remain in the top basket, medium balls fall into the second, and small balls keep moving down the stack. Each basket represents a different sieve, and the balls symbolize soil particles. This sorting process helps us understand how many of each size we have.
Sedimentation Analysis
Chapter 3 of 4
🔒 Unlock Audio Chapter
Sign up and enroll to access the full audio experience
Chapter Content
Sedimentation analysis is used only for the soil fraction finer than 75 microns...
Detailed Explanation
Sedimentation analysis is a method specifically designed for determining the particle size of very fine soils that are smaller than 75 microns. In this process, soil particles are suspended in distilled water and allowed to settle over time. The rate at which they settle depends on their size; larger particles settle faster. By measuring the concentration of particles at different depths over time, we can infer the size of the particles that have settled. This measurement includes using a hydrometer to establish the density of the suspension at various points.
Examples & Analogies
Imagine dropping different-sized beads into a jar of water. The larger beads sink quickly, while smaller ones take their time. By observing how deep the beads settle after a few minutes, you can get a sense of their sizes. In sedimentation analysis, we learn about soil particle sizes in a similar way.
Grain-Size Distribution Curve
Chapter 4 of 4
🔒 Unlock Audio Chapter
Sign up and enroll to access the full audio experience
Chapter Content
The size distribution curves, as obtained from coarse and fine grained portions, can be combined to form one complete grain-size distribution curve...
Detailed Explanation
A grain-size distribution curve is a graphical representation that combines results from both wet and dry sieving methods. This unified curve provides essential insights about the various sizes of soil particles in a sample, including the proportions of different types like gravel, sand, silt, and clay. The x-axis typically represents the particle size (usually on a logarithmic scale), while the y-axis shows the percentage of particles that are smaller than each size. This information is crucial for understanding the properties and behavior of the soil in engineering contexts.
Examples & Analogies
Consider this curve like a population graph that shows various age groups in a community. Just as the graph tells you how many people belong to each age bracket, the grain-size distribution curve shows you how many soil particles belong to different size categories. Both graphs help us understand the composition of the groups they represent.
Key Concepts
-
Wet Sieving: A method of separating soil particles using water, specifically effective for fine grains.
-
Sedimentation Analysis: A technique for finer particles that uses settling in liquid to determine size distribution.
-
Grain-Size Distribution Curve: A graph representing the sizes of soil particles, crucial for understanding soil behavior.
Examples & Applications
When testing soil, a sample might show 60% of grains passing through a 75 micron sieve, indicating a high presence of fine particles.
Use of sedimentation in a lab setting allows engineers to more accurately assess soil for construction projects, enhancing stability assessments.
Memory Aids
Interactive tools to help you remember key concepts
Rhymes
When fine is what you wish to find, wash it through with care in mind.
Stories
Imagine a small stream washing away grains, differentiating between big stones and tiny particles, just like wet sieving does.
Memory Tools
D for decision at 10%, 30%, 60%, gauge the grain, and know it in a format splendid.
Acronyms
WASH
Wet Analysis of Soil with Hydration.
Flash Cards
Glossary
- Wet Sieving
A method for separating fine soil particles from coarse ones by washing soil through a sieve.
- Sedimentation Analysis
A technique used to analyze soil particles finer than 75 microns by observing their settling in suspension.
- GrainSize Distribution Curve
A graphical representation of the distribution of sizes of particles in a soil sample.
- Effective Size
The particle size at which a specified percentage of the soil sample is finer.
- Uniformity Coefficient
A measure that describes the uniformity of soil particle sizes.
- Curvature Coefficient
A measure of the shape and gradation of the grain-size distribution curve.
Reference links
Supplementary resources to enhance your learning experience.